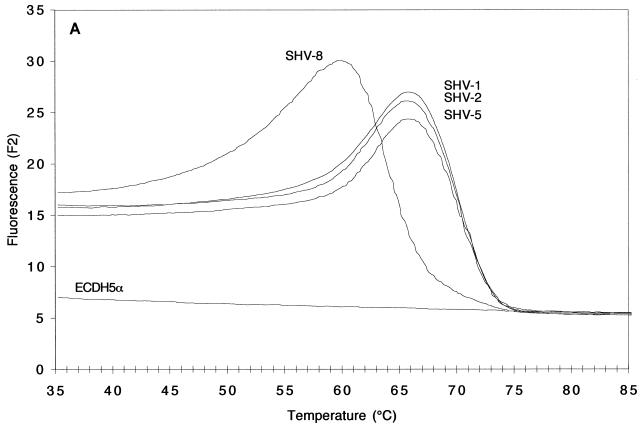
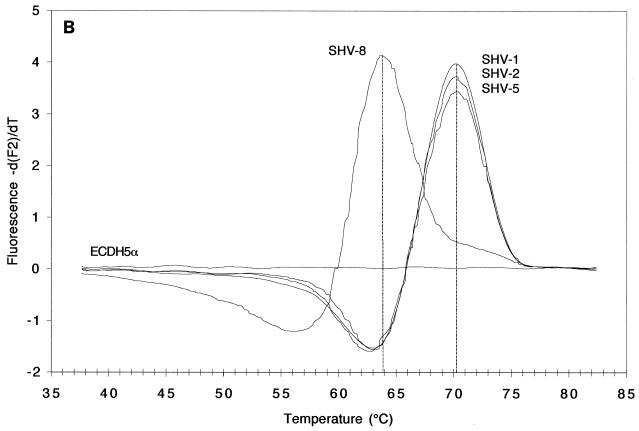
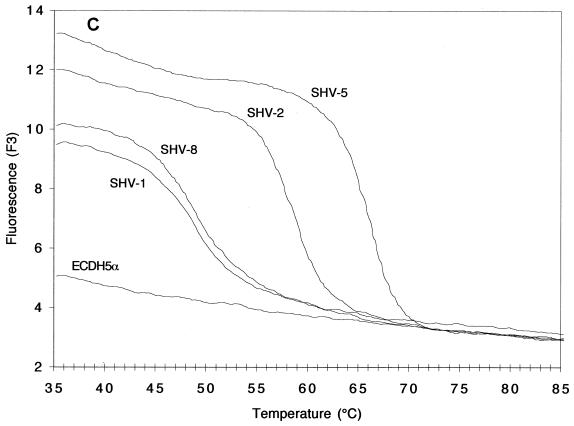
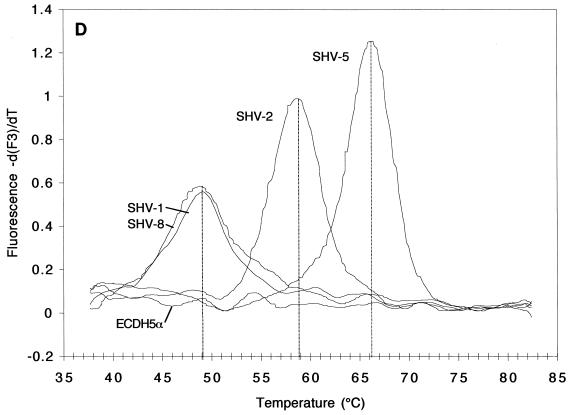
FIG. 2.
Melting curves (A and C; fluorescence F2 or F3 versus T) and melting peaks (B and D; plotted as the negative derivative of fluorescence F2 or F3 versus T) of blaSHV genes in standard strains. Fluorescence F2 (A and B) generated by the fluorophore of the mutation at codon 179 and recorded by channel 2, revealed melting peaks at higher T's for strains harboring blaSHV-1, blaSHV-2, and blaSHV-5 than for those harboring blaSHV-8, the representative with a mutation at codon 179. Fluorescence F3 (C and D), generated by the fluorophore of the mutation at codons 238 and 240 and recorded by channel 3, revealed melting peaks at three different T's: below 50°C for strains harboring blaSHV-1 and blaSHV-8 (two mismatches), ca. 59°C for strains harboring blaSHV-2 (one mismatch), and ca. 66°C for the strain expressing blaSHV-5 (no mismatches).


