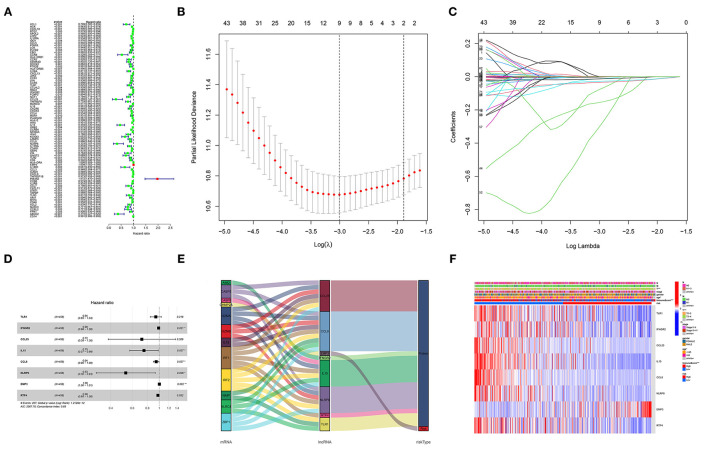
Figure 3.
Construction of the GRIP signature. (A) Forest map of 83 prognostic GRIPs identified by univariable Cox regression. (B,C) Lasso regression lambda.min and lambda.1se criteria, parameter. (D) Multivariable Cox regression model. (E) A Sankey diagram shows the relationship between GRIPs and the risk type (risk or protect). (F) The heatmap illustrates the association between the eight GRIPs and clinicopathological characteristics.

