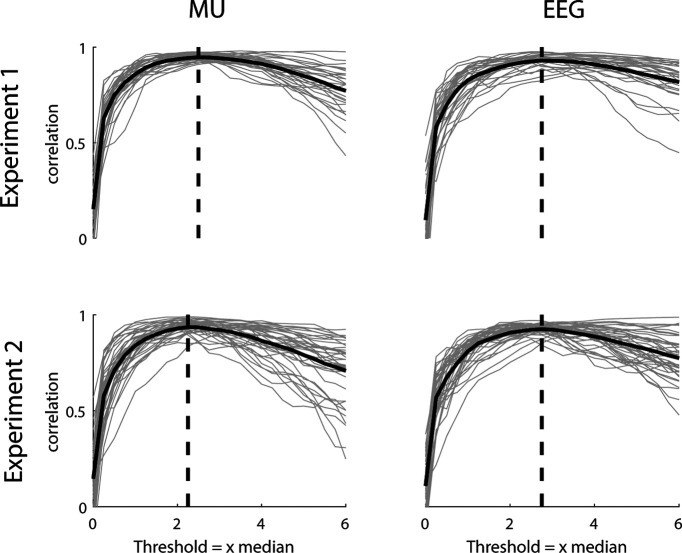
Figure 2.
β Burst threshold estimation. Correlation between β band power and number of samples above threshold for experiment 1 (top) and experiment 2 (bottom) for the MU (left) and EEG (right) data. Gray lines indicate single blocks while solid black lines indicate mean across blocks. For experiment 2, only the control condition was used. Dashed black lines indicate maximum correlation value and corresponding threshold.

