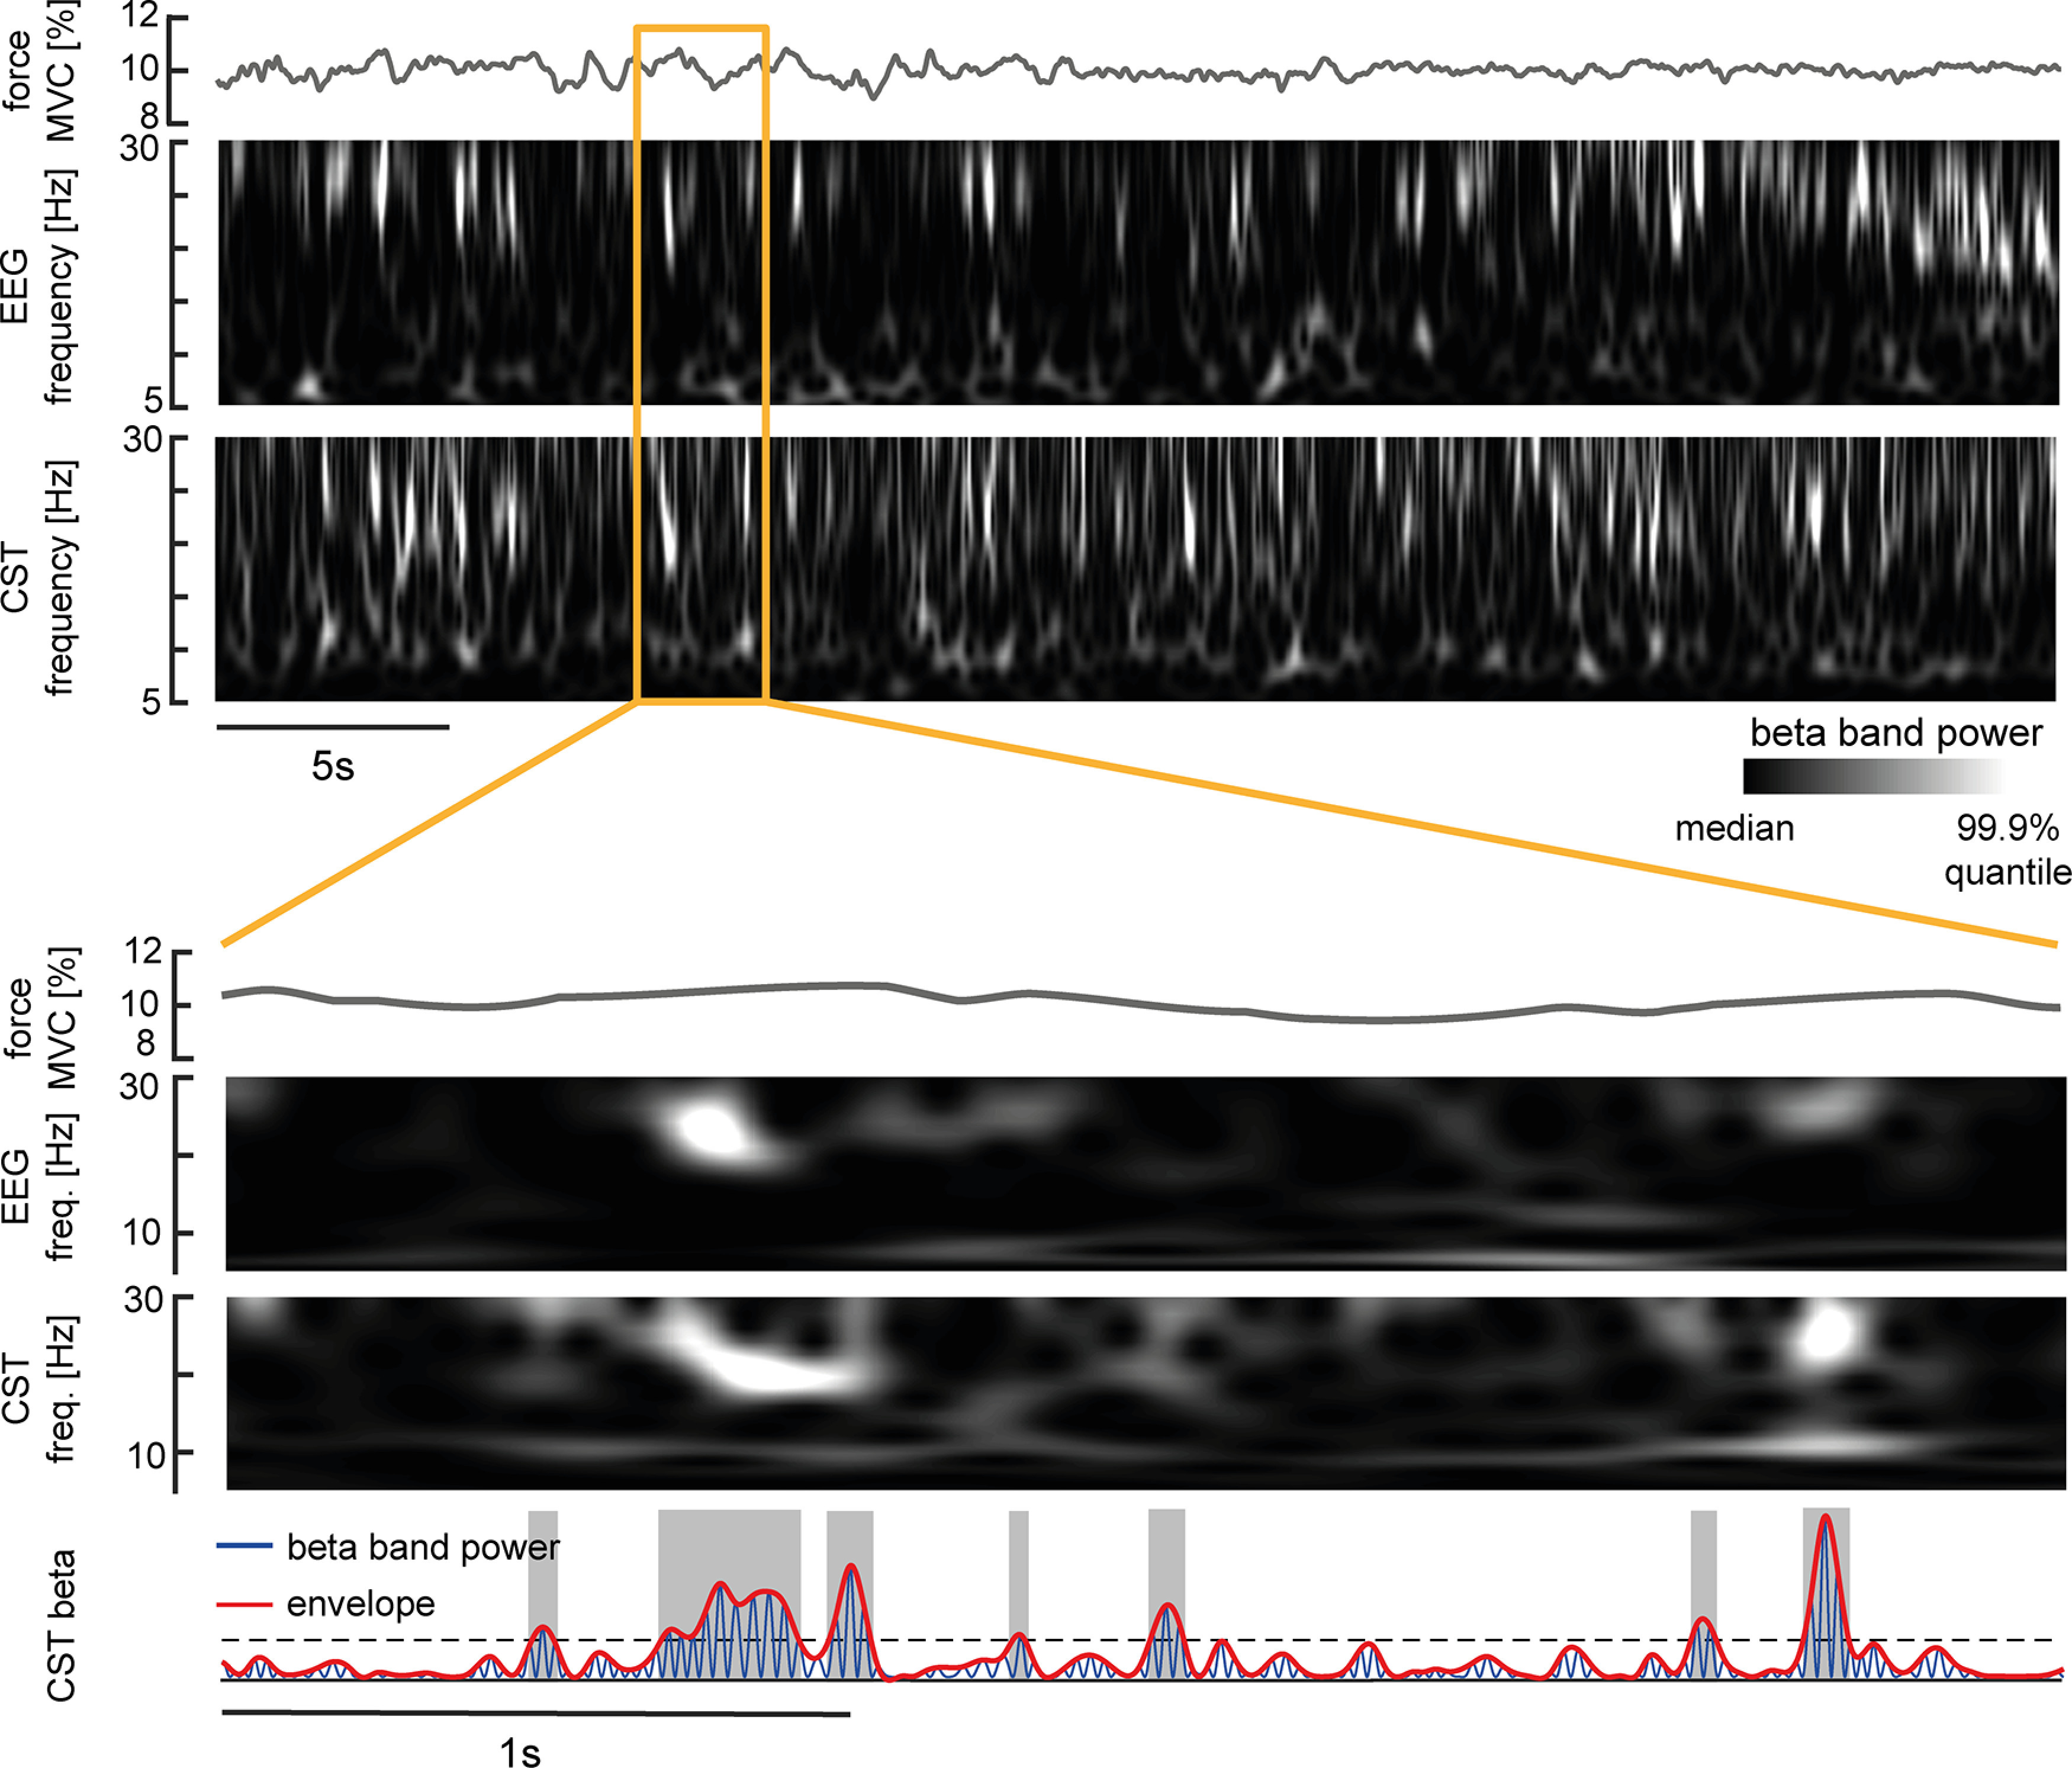
Figure 3.

β Power present in the EEG and MU pool shown in a representative subject. Top, Force because of dorsiflexion of the ankle, interpolated time-frequency spectrum inside the β band for surface Laplacian EEG and CST via continuous wavelet transform. Bottom, Zoom-into force, interpolated time-frequency-spectra of surface Laplacian EEG and CST, and β band power (blue) and maxima envelope (red) extracted from the bandpass filtered CST. The black dashed line indicates the threshold used to identify β bursts (ON, gray shaded areas) and valleys in between bursts (OFF).
