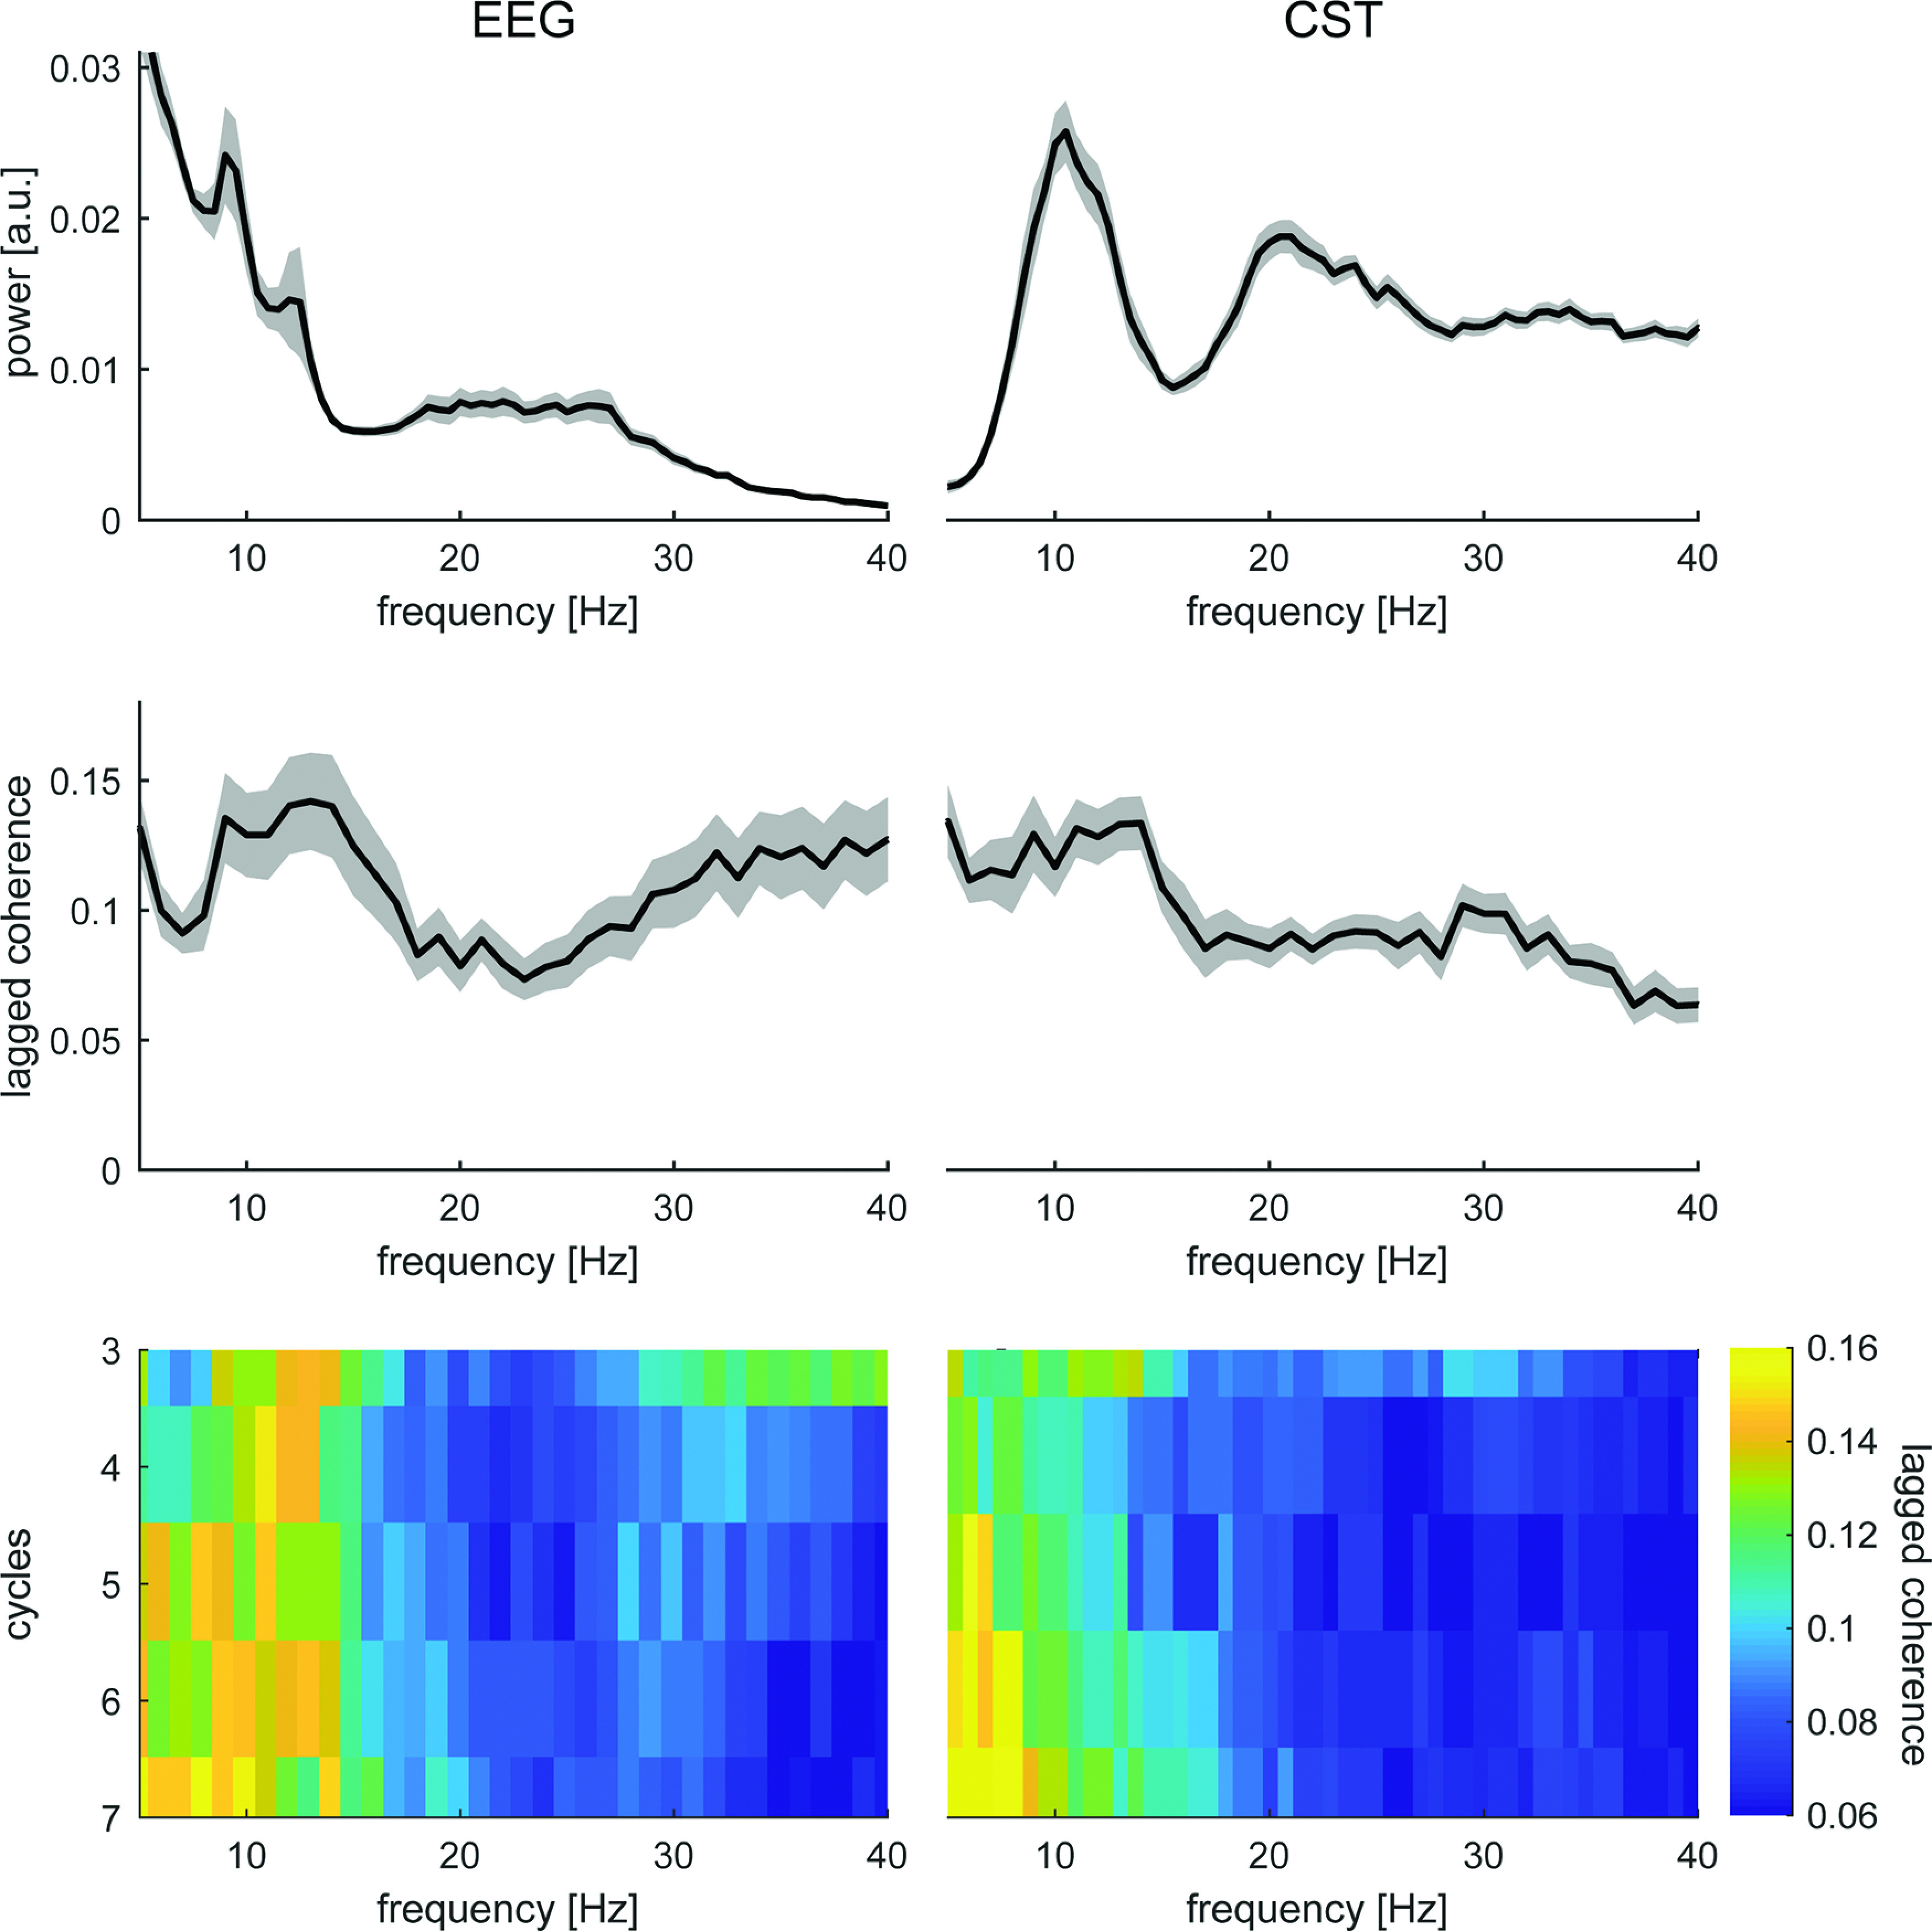
Figure 4.

Lagged coherence analysis for EEG (left) and MU activity (right). Top, Mean power spectral density normalized between 1 and 40 Hz across all blocks. Shaded areas indicate standard error of the mean (SEM). Middle, Mean lagged coherence at three cycles across all blocks. Shaded areas indicate SEM. Bottom, Mean lagged coherence for cycles 3–7 across blocks.
