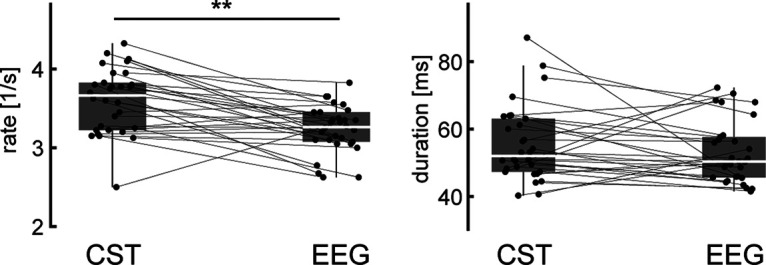
Figure 6.

Relationship between β bursts observed at the cortical and muscle levels. The rate at which β events occurred (left) and their mean duration (right) are shown for cortical (EEG) and peripheral (CST) signals across blocks by their median and quantiles. Values for individual blocks are marked in gray and connected observation sides of β events (i.e., CST and EEG). **p < 0.01.
