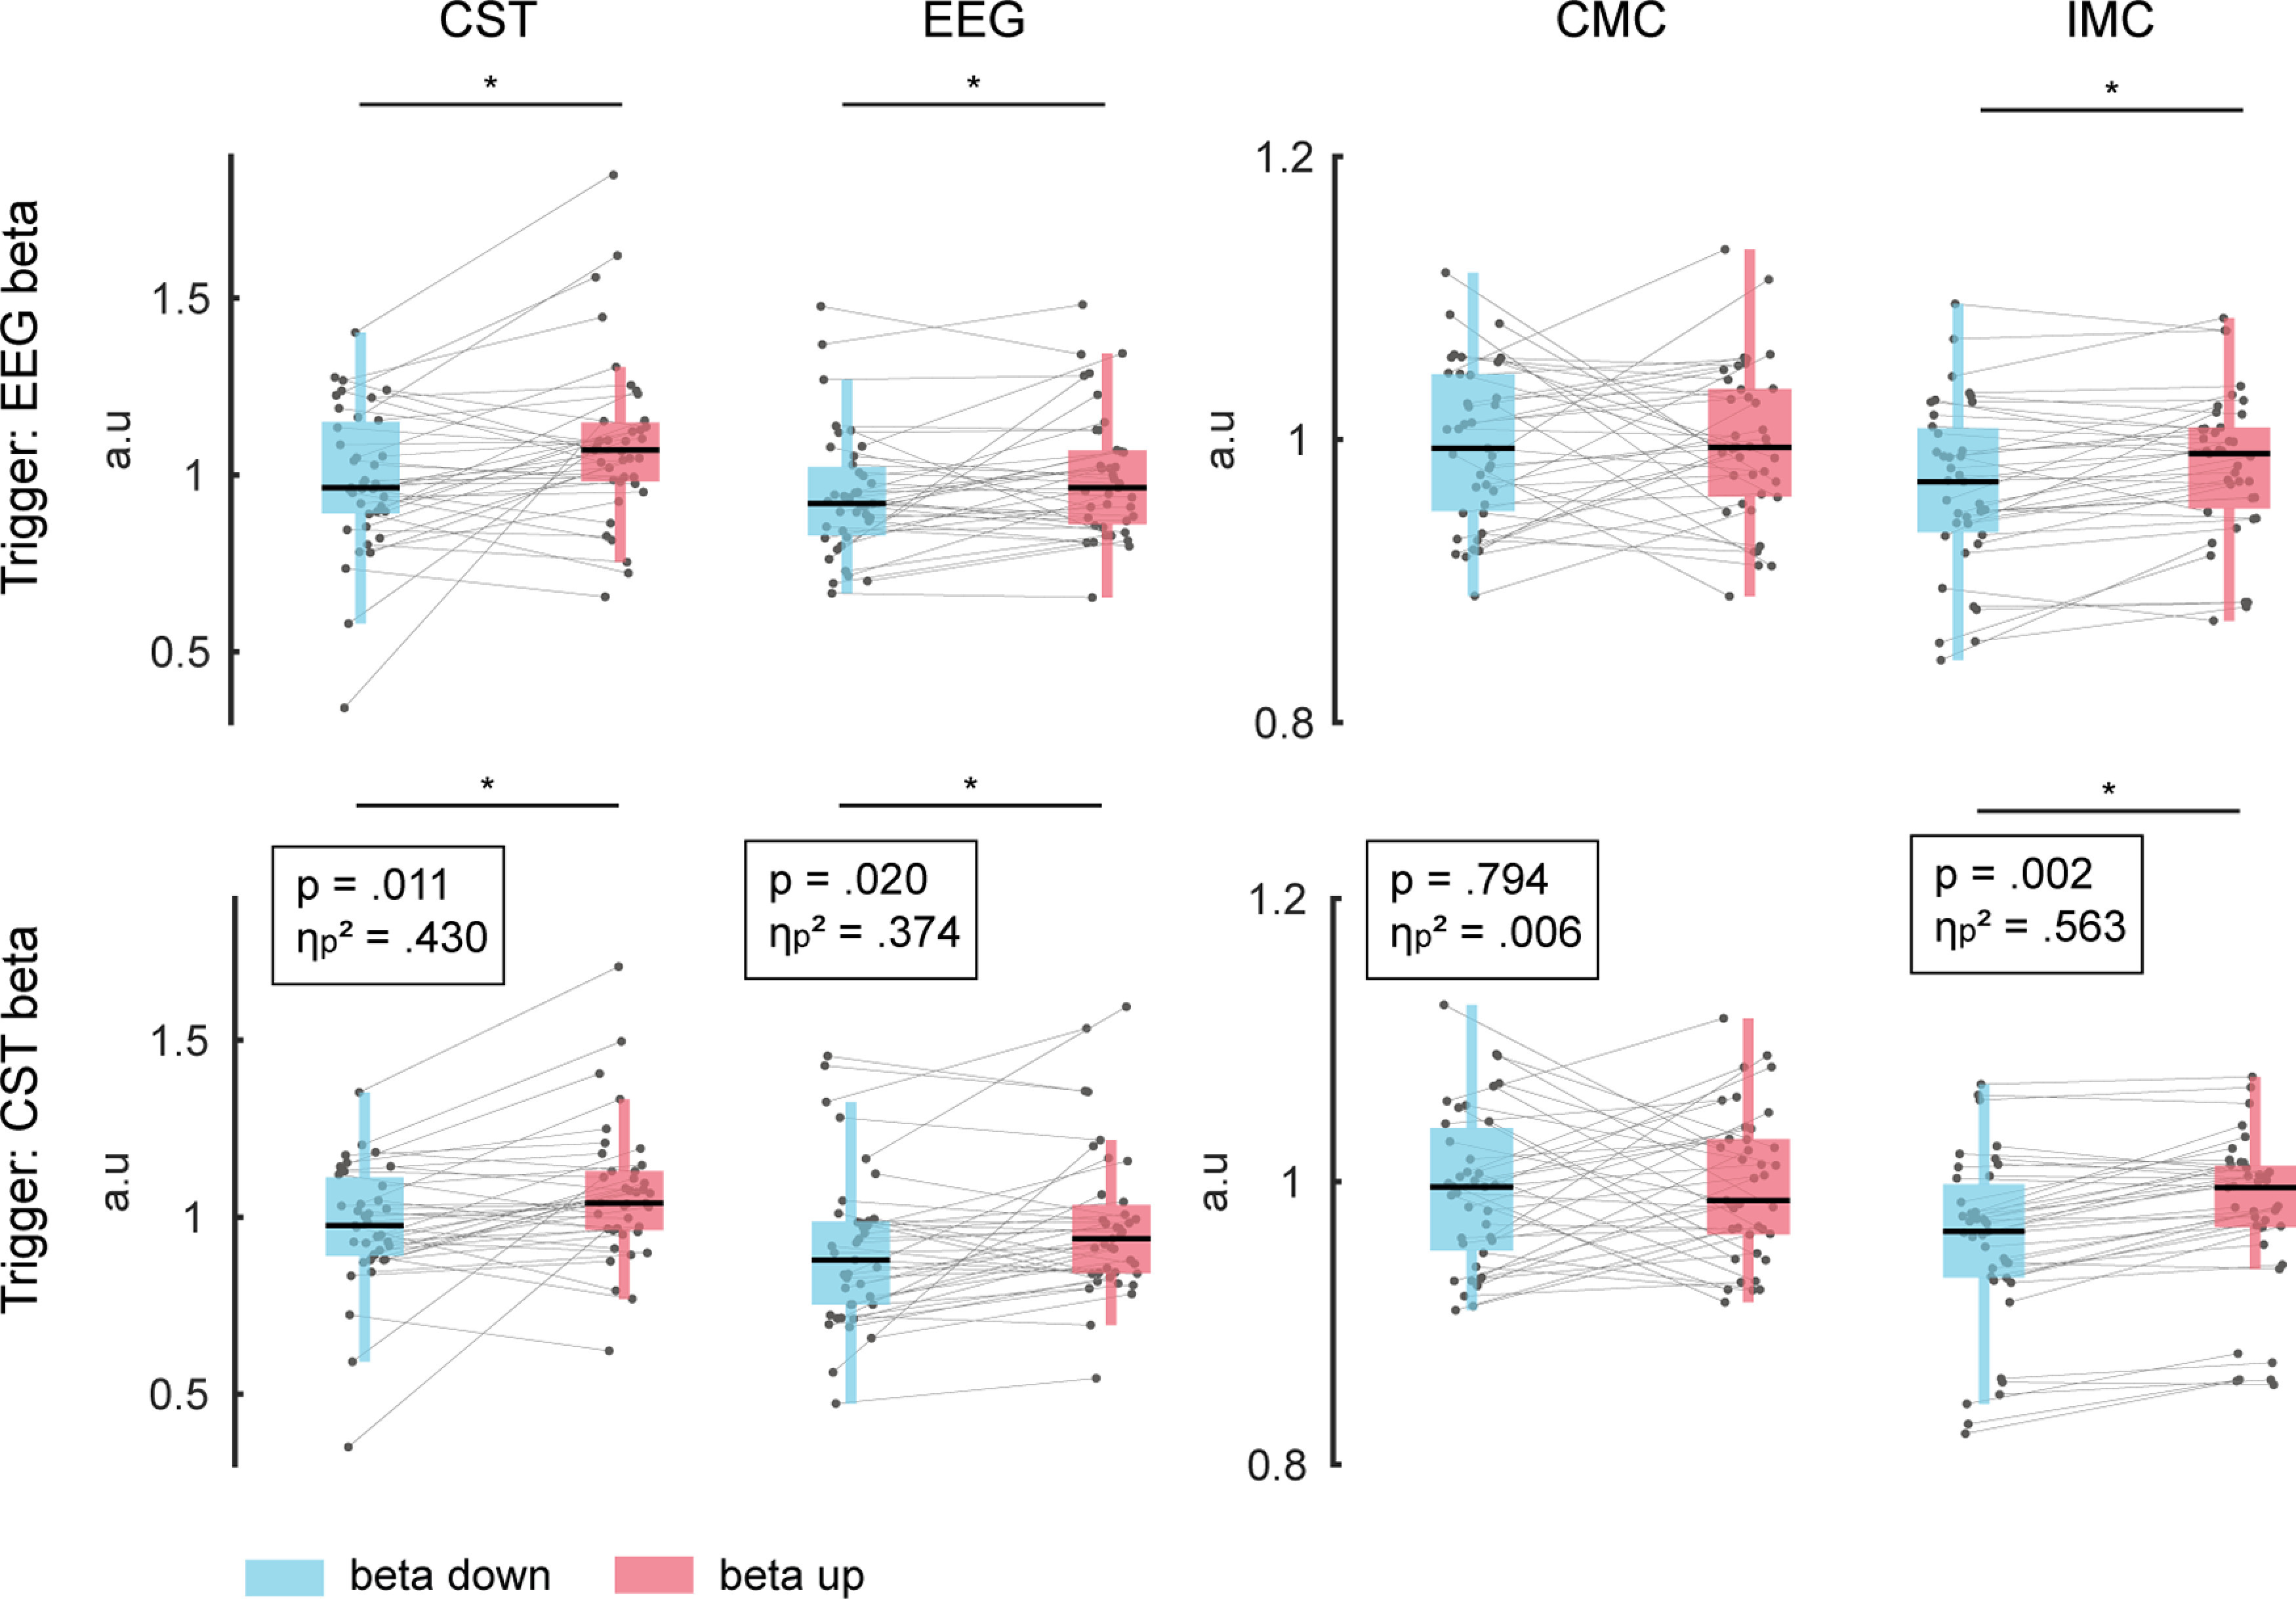
Figure 9.

Impact of volitional β feature modulation on spectral measures. From left to right, β band power extracted from the MU activity and EEG, β band coherence in the CMC and IMC across subjects during β feature down-modulation (blue) and up-modulation (red). Mean values were extracted from a 500-ms window centered around the ON periods identified in the EEG (top) and MU activity (CST, bottom) and were normalized by the corresponding values obtained during the control condition (no β neurofeedback). Gray dots indicate values for single block, while gray lines combine values corresponding to the same block. *p < 0.05. (a.u.: arbitrary units).
