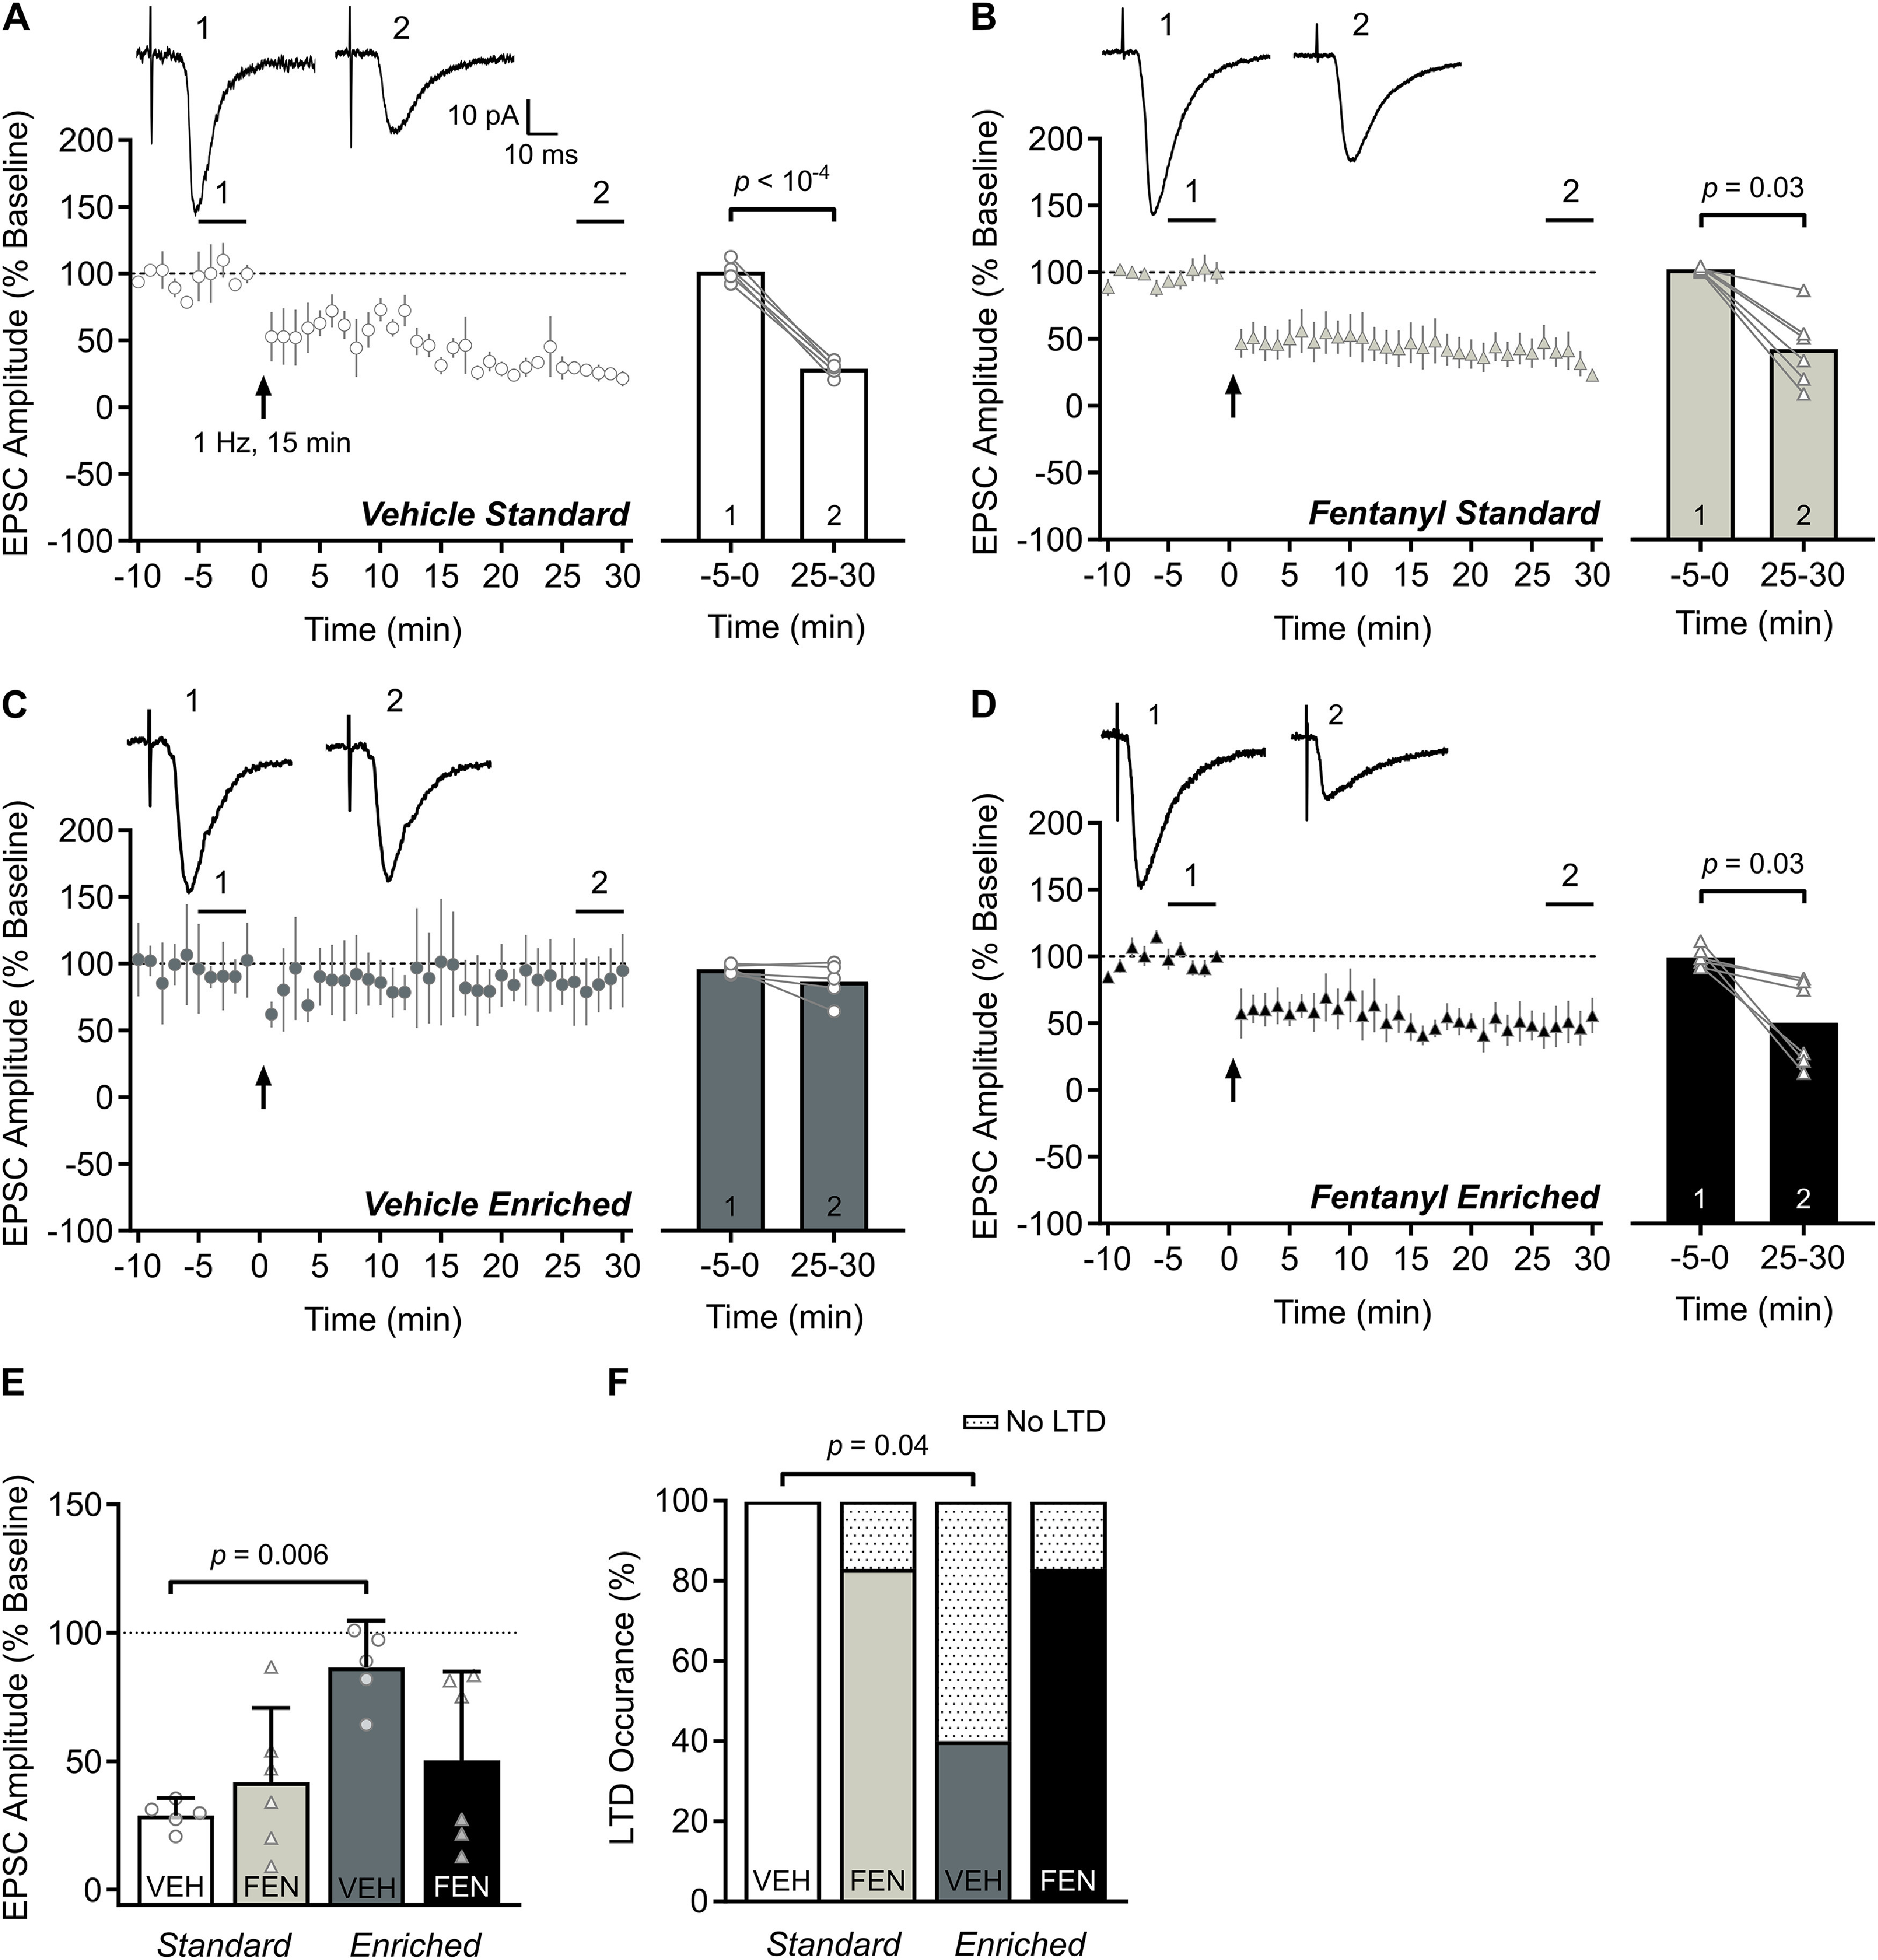
Figure 4.

Environmental enrichment suppresses LTD. A–D, Time course (left) of LTD of EPSCs following low frequency stimulation (900 electrical stimulation pulses at 1 Hz). Bar graphs (right) show group data comparing EPSC amplitudes at baseline (1) and at 25–30 min after LTD induction (2). Insets depict sample traces from times indicated on time course graph. A, Within-group comparisons indicate LTD was induced in S1 layer 2/3 neurons from vehicle-exposed, standard-housed mice and in (B) fentanyl-exposed, standard-housed mice. C, LTD was not induced in vehicle-exposed, enriched-housed mice, but was in (D) fentanyl-exposed, enriched-housed mice. E, Between-group comparisons of the EPSC amplitudes post-LTD induction indicate that vehicle-exposed, enriched-housed mice failed to induce LTD compared with their vehicle-exposed, standard-housed counterparts. F, Between-group comparisons of the occurrence of LTD indicate vehicle-exposed, enriched-housed mice had a lower occurrence of neurons that exhibit LTD than vehicle-exposed, standard-housed mice. n = 5–6 mice/group, 1 neuron/mouse. Data depict means and 95% confidence intervals.
