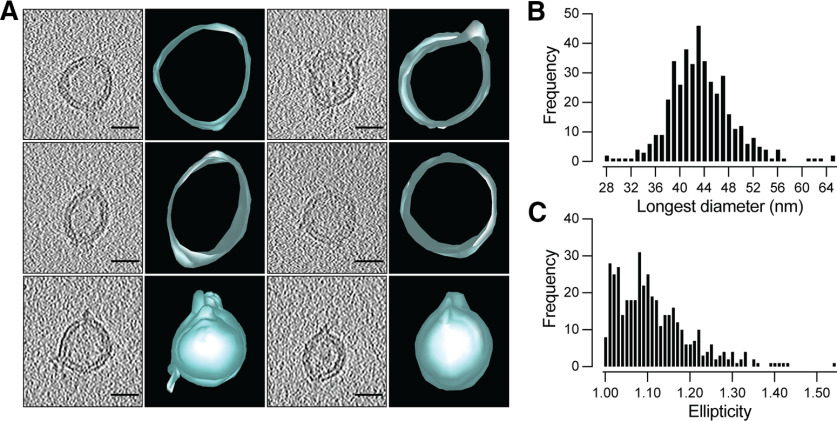
Figure 4.
Cryo-electron tomography of synaptic vesicles obtained by rho1D4-IP. A, Varied morphology of SVs as seen by cryo-electron microscopy and their corresponding three-dimensional reconstructions. Scale bar, 25 nm. B, Frequency distribution of SV diameters measured along the longest axis (n = 421). C, Frequency distribution of SV ellipticity defined as the ratio between the longest and orthogonal diameters of each vesicle.

