. 2020 May 19;10(32):18970–18977. doi: 10.1039/d0ra02104k

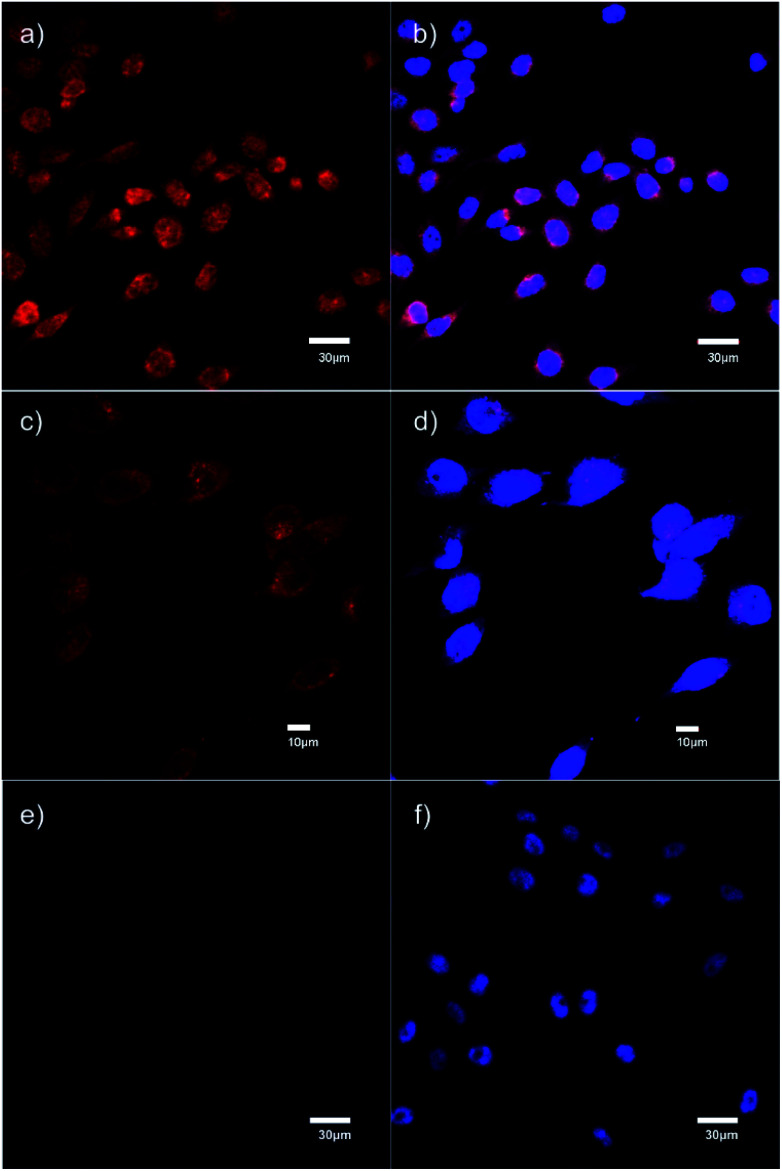
Fig. 5. Confocal fluorescence micrographs obtained using the bombesin–formazanate probe 7. Red images (from 7): excitation at 559 nm and emission collected between 605–705 nm. Blue images (DAPI): excitation at 405 nm and emission collected between 425–475 nm. (a) PC-3 cells stained with 7 (40× objective). (b) Overlay of PC-3 cells stained with DAPI (blue) and image (a). (c) PC-3 cells stained with 7 at 60× objective. (d) Overlay of PC-3 cells stained with DAPI (blue) and image (c) at 60× objective. (e) PC-3 cells blocked with 10-fold molar excess of 3 (40× objective). (f) Overlay of PC-3 cells stained with DAPI, blocked with 10-fold molar excess of 3 and image (e). Scale bar for (a), (b), (e) and (f) 30 μm, for (c) and (d) 10 μm.

Fig. 5