Abstract
Six new C12 polyketides, phomretones A–F (1–6), were isolated from the co-culture of Armillaria sp. and the endophytic fungus Phoma sp. YUD17001 associated with Gastrodia elata. Neither fungus produced these compounds when cultured alone. The structures of 1–6 were established on the basis of comprehensive spectroscopic analyses, while their absolute configurations were determined by the comparsion of experimental and calculated ECD spectra. Compounds 2–4 are diastereoisomers of each other and featured high levels of stereoisomerization and oxidation.
Co-cultivation of Phoma sp. YUD17001 with Armillaria sp. led to the production of six new C12 polyketides.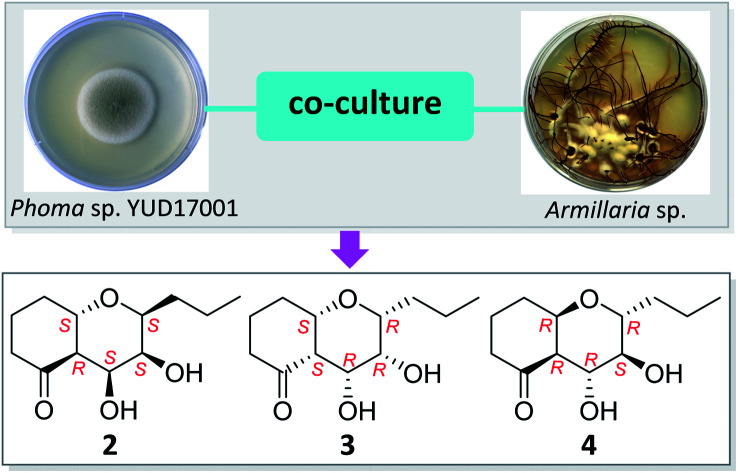
Introduction
Co-cultivation of microorganisms attracts substantial attention from both chemists and biologists as the activation of silent biosynthetic pathways can be utilized for the isolation and characterization of structurally novel and biologically meaningful molecules.1–4 Hitherto, co-culture systems have been developed with various microorganisms, including bacterium–fungus, bacterium–bacterium, bacterium–protist, archaea–fungus and fungus–fungus co-cultures, involving both budding and filamentous forms.2 Examples of the production of previously unknown secondary metabolites by co-culture include the penixylarins A–B,4 fusatricinones A–D,5 cytochathiazines,6 berkeleylactones,7 libertellenones,8 tetrapeptides,9 and the citrifelins.10
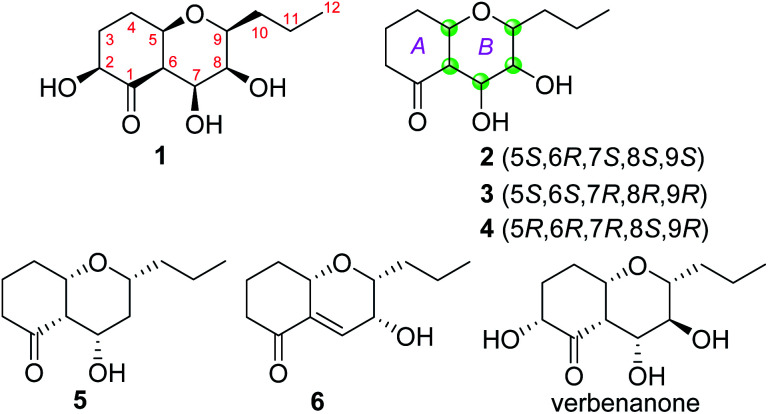
As part of our ongoing study of metabolites produced by fungal co-cultures,11–13 we analyzed the co-culture of the endophytic fungus Phoma sp. YUD17001 and the symbiotic fungus Armillaria sp. associated with Gastrodia elata. This led to the isolation of two phenolic, phexandiols A and B, and three aliphatic ester derivatives, phomesters A–C.11 Further scale-up fermentation followed by chemical investigation of the metabolites of this co-culture system yielded six new compounds, phomretones A–F (1–6) (Fig. 1), which were a series of structurally related C12 polyketides that differ in the geometry and substitution pattern. Notably, LC-MS analysis confirmed these metabolites were not detected in the culture broth of Phoma sp. YUD17001 or Armillaria sp., but were only produced during co-cultivation (Fig. S2 and S3, ESI†). Herein are reported the isolation, structure elucidation, and bioactivity evaluation for all of these compounds.
Fig. 1. Chemical structures of compounds 1–6 and verbenanone.
Results and discussion
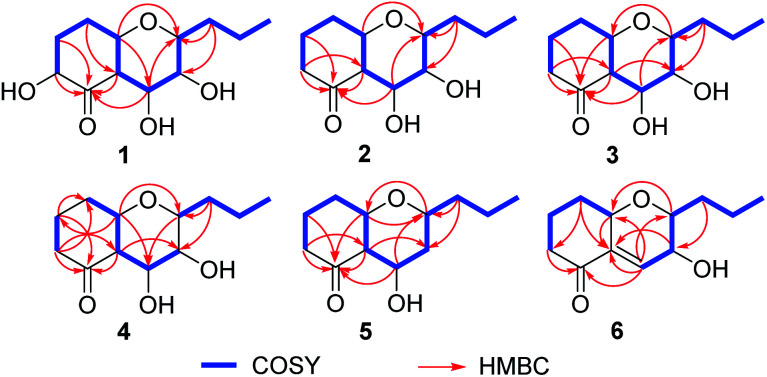
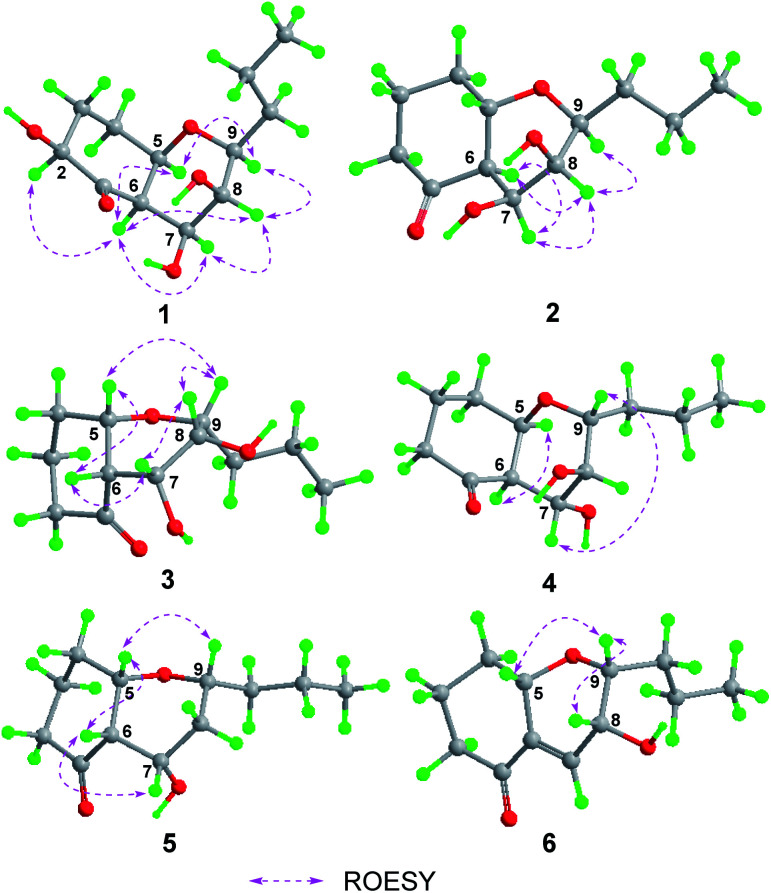
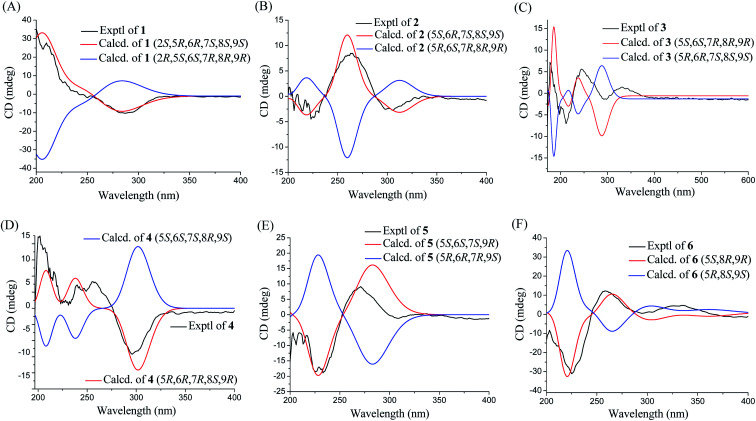
Phomretone A (1) was obtained as a colorless solid. A molecular formula of C12H20O5 was assigned by interpretation of HREIMS. The IR spectrum showed absorption bands at 3340 and 1721 cm−1 indicating the presence of hydroxyl and carbonyl groups. The 1D NMR data (Tables 1 and 2) of 1 revealed one methyl group, four methylenes, six methines including five oxygenated, and one nonprotonated carbon. Interestingly, these data were similar to those for a recently reported novel polyketide, verbenanone, described by Chunshun Li et al.14 The major difference was the C-1, C-3, C-5, C-7, and C-9 signals of compound 1 were upfield (ΔδC −4.0, −2.0, −4.7, −8.7, and −5.5, respectively) when compared with verbenanone, whereas C-6 and C-8 of 1 were shifted downfield (ΔδC +2.3 and +0.5). Subsequently, following detailed inspection of the 1H–1H COSY and HMBC data (Fig. 1) of 1, its planar structure was determined as being the same as that of verbenanone, suggesting that 1 might be a stereoisomer of verbenanone.14 The relative configuration of 1 was established based on the ROESY correlations as indicated in Fig. 2. The ROESY spectrum showed cross-peaks of H-2/H-6, H-5/H-6, H-5/H-9, H-6/H-7/H-8, and H-8/H-9 indicating that H-5, H-6, and H-9 were on the same side and assigned in the α-position, whereas 2-OH, 7-OH, and 8-OH were β-oriented. The absolute configuration of 1 was elucidated by comparing the quantum chemical calculations of the calculated electronic circular dichroism (ECD) spectra at the B3LYP/6-31G(d,p) level in methanol with the experimental one. The calculated ECD curve of the (2S,5R,6R,7S,8S,9S)-enantiomer showed the identical Cotton effects (CEs) as the experimental ECD curve for 1 (Fig. 3A). Therefore, the absolute configuration of 1 was assigned as 2S, 5R, 6R, 7S, 8S, 9S, and 1 was identified as the stereoisomer of verbenanone.14
1H NMR data for compounds 1–6 (δ in ppm, J values in Hz)a.
| No. | 1 | 2 | 3 | 4 | 5 | 6 |
|---|---|---|---|---|---|---|
| 1 | ||||||
| 2 | 4.16, dd (12.4, 6.8) | 2.30, m | 2.42, m | 2.44, overlap | 2.40, m | 2.49, d (18.0) |
| 2.26, m | 2.26, m | 2.26, m | 2.31, m | |||
| 3 | 2.22, m | 2.00, m | 2.02, overlap | 2.02, m | 2.03, overlap | 1.98, m |
| 1.47, overlap | 1.56, overlap | 1.88, overlap | 1.53, overlap | 1.86, overlap | 1.73, m | |
| 4 | 2.13, m | 2.13, m | 2.03, overlap | 2.11, m | 2.01, overlap | 2.16, m |
| 1.79, m | 1.70, m | 1.86, overlap | 1.77, m | 1.85, overlap | 1.56, overlap | |
| 5 | 3.79, dt (10.8, 4.0) | 3.79, m | 4.32, m | 3.23, m | 4.34, br s | 4.26, m |
| 6 | 2.48, d (10.8) | 2.48, m | 2.80, m | 2.46, overlap | 2.52, br s | |
| 7 | 4.35, br s | 4.36, br s | 4.37, m | 3.76, m | 4.46, m | 6.46, br s |
| 8 | 3.14, dd (9.6, 2.4) | 3.14, dd (9.6, 3.2) | 3.32, m | 3.08, overlap | 1.51, m | 3.92, m |
| 9 | 3.54, m | 3.53, m | 3.49, m | 3.10, overlap | 3.72, m | 3.26, m |
| 10 | 1.79, overlap | 1.79, m | 1.70, m | 1.80, m | 1.40, overlap | 1.82, m |
| 1.37, overlap | 1.37, overlap | 1.32, overlap | 1.37, overlap | 1.29, overlap | 1.42, overlap | |
| 11 | 1.57, overlap | 1.59, overlap | 1.51, m | 1.56, overlap | 1.39, overlap | 1.60, overlap |
| 1.36, overlap | 1.36, overlap | 1.31, overlap | 1.36, overlap | 1.32, overlap | 1.42, overlap | |
| 12 | 0.93, t (7.2) | 0.93, t (7.2) | 0.91, t (7.2) | 0.93, t (7.2) | 0.90, t (6.8) | 0.96, t (7.2) |
Measured at 400 MHz in methanol-d4.
13C NMR data for compounds 1–6 (δ in ppm)a.
| No. | 1 | 2 | 3 | 4 | 5 | 6 |
|---|---|---|---|---|---|---|
| 1 | 208.4, C | 210.1, C | 212.4, C | 210.1, C | 212.7, C | 201.3, C |
| 2 | 75.7, CH | 41.2, CH2 | 42.5, CH2 | 41.9, CH2 | 42.6, CH2 | 40.5, CH2 |
| 3 | 30.8, CH2 | 21.5, CH2 | 22.7, CH2 | 22.6, CH2 | 22.6, CH2 | 19.6, CH2 |
| 4 | 29.7, CH2 | 31.6, CH2 | 30.7, CH2 | 32.2, CH2 | 31.4, CH2 | 31.7, CH2 |
| 5 | 74.7, CH | 74.5, CH | 74.4, CH | 79.9, CH | 74.9, CH | 76.9, CH |
| 6 | 57.5, CH | 59.5, CH | 57.3, CH | 62.1, CH | 55.5, CH | 141.8, C |
| 7 | 66.9, CH | 66.7, CH | 67.6, CH | 72.1, CH | 64.3, CH | 135.7, CH |
| 8 | 73.2, CH | 73.5, CH | 69.7, CH | 76.3, CH | 36.1, CH2 | 68.7, CH |
| 9 | 76.4, CH | 76.4, CH | 77.1, CH | 80.8, CH | 73.5, CH | 79.7, CH |
| 10 | 35.2, CH2 | 35.2, CH2 | 35.3, CH2 | 35.1, CH2 | 39.4, CH2 | 35.7, CH2 |
| 11 | 19.6, CH2 | 19.6, CH2 | 19.3, CH2 | 19.6, CH2 | 19.5, CH2 | 19.8, CH2 |
| 12 | 14.5, CH3 | 14.5, CH3 | 14.5, CH3 | 14.4, CH3 | 14.5, CH3 | 14.4, CH3 |
Measured at 100 MHz in methanol-d4.
Fig. 2. Key 1H–1H COSY and HMBC correlations of 1–6.
Fig. 3. Conformations and key ROESY correlations of 1–6.
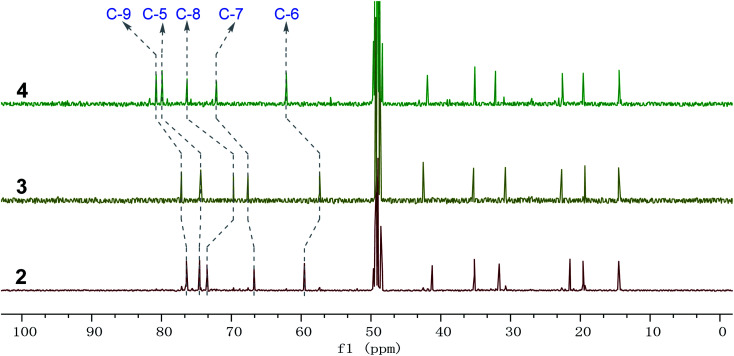
Phomretones B (2), C (3), and D (4) were also isolated as colorless solids. Their HRESIMS data established the identical molecular formula of C12H20O4 ([M + Na]+m/z 251.1251, 251.1254, and 251.1253, respectively). Comparison of the 13C NMR data (Table 2) of 2–4 suggested that three compounds possess similar carbon chemical shifts. Markedly, notable differences were observed for resonances attributable to the B ring with chiral carbon signals, which could be influenced by the different spatial configurations of C-5, C-6, C-7, C-8, and C-9 (Fig. 5). Furthermore, their 1H and 13C NMR data (Tables 1 and 2) showed considerable resemblance to that of 1. The main difference between compounds 2–4 and 1 was the lack of an oxygenated methine signal (δH 4.16, δC 75.7), suggesting the absence of a hydroxyl group at C-2 in 2–4. This was ascertained with the DEPT and 2D NMR experiments (ESI†). The key 1H–1H COSY and HMBC correlations observed for 2–4 (Fig. 2) showed that the three compounds share identical constitution atomic arrangement, being stereoisomers of each other. This was further supported by comparison of the ROESY data (Fig. 3) of 2–4. For 2, the key ROESY correlations of H-6/H-7/H-8 and H-8/H-9 supported their β-orientation. In contrast, H-5 was assigned to α-orientation. For compound 3, the β-orientations of H-5, H-6, H-7, H-8, and H-9 was inferred through ROESY correlations of H-5/H-6/H-7/H-8/H-9. Moreover, the relative configuration of 4 was determined as shown (Fig. 3). The ROESY correlation of H-5/H-6 suggested that H-5 and H-6 are α-oriented. The β-orientations assigned to H-7 and H-9 were supported by the ROESY cross-peaks of H-7/H-9. To verify the above structural assignment and to determine the absolute configurations of 2–4, the ECD calculation was performed, together with comparison of the CEs in the calculated and experimental curves (Fig. 4B–D). On the basis of the above, the absolute configurations of compounds 2–4 were deduced to be (5S,6R,7S,8S,9S), (5S,6S,7R,8R,9R), and (5R,6R,7R,8S,9R), respectively.
Fig. 5. Comparison of 13C NMR spectra of compounds 2–4 from δC 0 to 100 ppm; 2–4 possess similar carbon chemical shifts; the major deviations among 2–4 are the chiral carbon signals C-5, C-6, C-7, C-8, and C-9, respectively.
Fig. 4. Experimental and calculated ECD spectra of compounds 1–6 (A–F).
Phomretone E (5) exhibited a molecular formula of C12H20O3, which was one oxygen atom mass unit less than that of 2. Its 1D NMR spectroscopic data (Tables 1 and 2) were highly similar to those of 2, except that an oxygenated methine (δH 3.16, δC 73.5) was absent and a methylene signal at C-8 (δH 1.51, δC 36.1) was present in 5. Combined with the molecular mass information, 5 was identified to be a deoxy analogue of 2. Further analyses of NMR data, including COSY, HMBC, and ROESY experiments (Fig. 2 and 3), yielded the planar structure and relative configuration of 5. Additionally, the calculated ECD curve for the (5S,6S,7S,9R)-enantiomer (Fig. 4E) coincided well with the experimental data of 5. Accordingly, the structure of 5 was defined as shown in Fig. 1.
Phomretone F (6) was purified as a colorless solid, and its molecular formula was determined as C12H18O3 on the basis of HRESIMS data, corresponding to four degrees of unsaturation. Its 1D NMR data (Tables 1 and 2) resembled those of 3, with the exception of the presence of an additional trisubstituted double bond [δH 6.46 (1H, br s, H-7); δC 141.8 (C-6), 135.7 (C-7)] and the absence of one hydroxyl group in 6. Further analysis of the HMBC correlations from H-5 (δH 4.26) and H-7 (δH 6.46) to C-6 (δC 141.8), and from H-7 (δH 6.46) to C-9 (δC 79.7) indicated the location of the double bond between C-6 and C-7. The ROESY experiment (Fig. 3) showed correlations between H-5 and H-9 as well as between H-8 and H-9, which revealed the H-5, H-8, and H-9 all to be in a β-orientation relative configuration. As shown in Fig. 4F, the calculated ECD spectrum for (5S,8R,9R)-6 matched well with the experimental ECD spectrum, which elucidated the absolute configuration of 6 as 5S, 8R, 9R.
All isolated compounds (1–6) were tested in cytotoxicity, anti-acetylcholinesterase, and anti-PTP1B enzyme assays, but none showed significant inhibitory activities (details see ESI†).
Conclusions
In summary, there was no evidence of the production of the phomretones A–F by either fungus when grown as axenic cultures, which may be a result of the co-culture of Phoma sp. YUD17001 with Armillaria sp. Consequently, the present study may serve as a further example of the successful application of co-culture approaches for expanding the metabolic profile of microorganisms. Furthermore, the study will provide an opportunity to deepen the understanding of the interactions among the fungal community associated with G. elata habitats and their relationship with the host plant.
Experimental section
General experimental procedures
Optical rotation, UV, and IR data were obtained using JASCO P-1020 polarimeter, Shimadzu UV2401PC, and Bruker Tensor-27 with KBr pellets, respectively. CD spectra were recorded on an Applied Photophysics digital circular dichroism chiroptical spectrometer (Surrey, UK). 1D and 2D NMR spectra were recorded in methanol-d4 using tetramethylsilane as internal standard on a Bruker DRX-400 MHz spectrometer (Bruker Co., Karlsruhe, Germany). HRESIMS was performed using an Agilent G3250AA Q-TOF MS (Agilent, Santa Clara, CA, USA). Preparative HPLC was performed on an Agilent 1260 series equipped with a DAD detector and a Zorbax SB-C18 (250 × 9.4 mm, 5 μm) semipreparative column. Silica gel (200–300 mesh), Sephadex™ LH-20 gel (Uppsala, Sweden), and RP-C18 silica gel (150–200 mesh, Merck) were used for column chromatography (CC). Fractions were monitored by TLC (GF254, Qingdao Haiyang Chemical Co. Ltd), with spots were detected by spraying with 10% H2SO4 in ethanol, followed by heating.
Fungal material
Identification of two fungi (Phoma sp. YUD17001 and Armillaria sp.) was based on sequence data analysis of the internal transcribed spacer (ITS) regions of the 18S rRNA (GenBank accession numbers MH665638 and MK079569, respectively). More details about the experimental procedures are provided in work described previously.11
Co-culture conditions
Scale-up liquid co-cultures of Phoma sp. YUD17001 and Armillaria sp. were performed according to the previously reported method.11
Extraction and isolation
The whole co-cultures (50 L) were separated from the mycelium by vacuum filtration and partitioned with ethyl acetate (EtOAc) three times. The extract was evaporated under reduced pressure, yielding 11.0 g of brown extract. The extract was subjected to silica gel CC with a CHCl3–MeOH gradient system (100 : 0, 50 : 1, 30 : 1, 10 : 1, 1 : 1, and 0 : 100 v/v) to yield six fractions (A–F). Fraction B was further submitted to Sephadex LH-20 gel CC (CHCl3–MeOH, 1 : 1 v/v), and was pooled according to TLC analysis data to afford four combined subfractions (B1–B4). Elution of B1 with petroleum ether (PE)–EtOAc (9 : 1 and 3 : 1 v/v) afforded 5 (6.4 mg). Fraction B3 was divided into three portions (B3.1–B3.3) by silica gel CC (PE–EtOAc, 20 : 1–5 : 1 v/v) to obtain further fractions. Fraction B3.2 was fractionated by RP-C18 CC (MeOH–H2O, 1 : 4–3 : 2 v/v) to yield 2 (9.0 mg), 3 (7.8 mg), and 4 (2.0 mg). Compound 6 (tR = 26 min, 2.5 mg) was isolated by fractionation of B4 using semipreparative HPLC (MeOH–H2O, 7 : 3 v/v). Fraction C was further fragmented by RP-C18 CC (MeOH–H2O, 1 : 9–1 : 0 v/v) to yield five subfractions (C1–C5). Purification of C2 over Sephadex LH-20 (MeOH) gave 1 (3.2 mg).
Phomretone A (1)
Colorless solid; [α]23D +8.4 (c 0.32, MeOH); UV (MeOH) λmax (log ε) 228 (0.29), 267 (0.24) nm; IR (KBr) νmax 3340, 2956, 2870, 1721, 1358, 1252 cm−1; 1H and 13C NMR data see Tables 1 and 2; HRESIMS m/z 267.1208 [M + Na]+ (calcd for C12H20O5Na, 267.1203).
Phomretone B (2)
Colorless solid; [α]23D +34.3 (c 0.24, MeOH); UV (MeOH) λmax (log ε) 232 (0.50) nm; IR (KBr) νmax 3335, 2955, 2878, 1728, 1374, 1250 cm−1; 1H and 13C NMR data see Tables 1 and 2; HRESIMS m/z 251.1251 [M + Na]+ (calcd for C12H20O4Na, 251.1254).
Phomretone C (3)
Colorless solid; [α]23D +39.8 (c 0.41, MeOH); UV (MeOH) λmax (log ε) 231 (0.53) nm; IR (KBr) νmax 3335, 2953, 2878, 1726, 1374, 1253 cm−1; 1H and 13C NMR data see Tables 1 and 2; HRESIMS m/z 251.1254 [M + Na]+ (calcd for C12H20O4Na, 251.1254).
Phomretone D (4)
Colorless solid; [α]23D +33.6 (c 0.22, MeOH); UV (MeOH) λmax (log ε) 253 (0.63) nm; IR (KBr) νmax 3336, 2955, 2870, 1723, 1358, 1253 cm−1; 1H and 13C NMR data see Tables 1 and 2; HRESIMS m/z 251.1253 [M + Na]+ (calcd for C12H20O4Na, 251.1254).
Phomretone E (5)
Colorless solid; [α]23D −14.8 (c 0.14, MeOH); UV (MeOH) λmax (log ε) 245 (0.78) nm; IR (KBr) νmax 3334, 2956, 2870, 1723, 1358, 1254 cm−1; 1H and 13C NMR data see Tables 1 and 2; HRESIMS m/z 235.1304 [M + Na]+ (calcd for C12H20O3Na, 235.1305).
Phomretone F (6)
Colorless solid; [α]23D +60.1 (c 0.11, MeOH); UV (MeOH) λmax (log ε) 241 (2.14) nm; IR (KBr) νmax 3335, 2955, 2880, 1723, 1653, 1378, 1252 cm−1; 1H and 13C NMR data see Tables 1 and 2; HRESIMS m/z 209.1183 [M − H]− (calcd for C12H17O3, 209.1183).
TDDFT-ECD calculations
The conformational search for the molecule was carried out using the MMFF94S force field and CONFLEX software.15 The stable conformers with relative energy within a 5.0 kcal mol−1 energy window were obtained. The conformers obtained were further optimized with the software package Gaussian 09. Methanol was used as a solvent with the polarizable continuum solvent model (PCM). Time dependent density functional theory (TDDFT) at the B3LYP/6-311+G(d,p) level in the gas phase was used for ECD calculations.16,17 Boltzmann statistics were applied for the final simulations of the ECD spectra. These steps were performed with the software SpecDis1.64.18
HPLC-MS analysis
LC-MS experiments were carried out by the detector of Agilent G3250AA Q-TOF mass spectrometer with electrospray ionization (ESI) source. The data were acquired in the scan mode at m/z 100–1000 in the positive ionization mode. Chromatography was performed using a Zorbax Eclipse XDB-C18 column (150 × 2.1 mm, 5 μm) with a H2O (A)/MeCN (B) gradient at a flow rate of 0.5 mL min−1. The injection volume was set to 2 μL (concentration of 0.5 mg mL−1). The solvent gradient time program was as follows: initial 10% B, then linear increase to 40% at 25 min, 65% at 35 min, 85% at 45 min, 95% at 55 min, and hold for 5 min before returning to starting conditions.
Cytotoxicity assay
The in vitro cytotoxicity of compounds 1–6 was assessed by 3-(4,5-dimethylthiazol-2-yl)-5(3-carboxymethoxyphenyl)-2-(4-sulfophenyl)-2H-tetrazolium (MTS) assay on five human cancer cell lines (HL-60, A-549, SMMC-7721, MCF-7, and SW480) performed,19,20 and cisplatin was used as a positive control. The cells were seeded onto 96-well plates at 2 × 10⁴ cells per well and after 24 h the compounds were added in different concentrations. Subsequently, MTS was added to the culture medium and the absorbance at 490 nm was measured with a microplate reader. The proliferation rate was calculated as the ratio of absorbance to that of the control.
AChE inhibitory assay
Inhibitory activities of compounds 1–6 on AChE enzyme were determined by using modified Ellman's method as described in a previous study.12
PTP1B inhibitory bioassay
PTP1B activity was determined by measuring the rate of hydrolysis of a surrogate substrate, p-nitrophenyl phosphate.21,22
Conflicts of interest
There are no conflicts to declare.
Supplementary Material
Acknowledgments
This work was financially supported by grants from the Natural Science Foundation of China (No. 81603005 and 81860623), a project of Yunling Scholars of Yunnan Province, the Program for Changjiang Scholars and Innovative Research Team in University (IRT_17R94).
Electronic supplementary information (ESI) available: 1D and 2D NMR, HRESIMS, HPLC-MS, and UV spectra of phomretones A–F, along with other details. See DOI: 10.1039/d0ra02524k
Notes and references
- Sugiyama R. Nishimura S. Ozaki T. Asamizu S. Onaka H. Kakeya H. Angew. Chem., Int. Ed. 2016;128:10434–10438. doi: 10.1002/ange.201604126. [DOI] [PubMed] [Google Scholar]
- Bertrand S. Bohni N. Schnee S. Schumpp O. Gindro K. Wolfender J. L. Biotechnol. Adv. 2014;32:1180–1204. doi: 10.1016/j.biotechadv.2014.03.001. [DOI] [PubMed] [Google Scholar]
- Adnani N. Rajski S. R. Bugni T. S. Nat. Prod. Rep. 2017;34:784–814. doi: 10.1039/C7NP00009J. [DOI] [PMC free article] [PubMed] [Google Scholar]
- Yu G. Sun Z. Peng J. Zhu M. Che Q. Zhang G. Zhu T. Gu Q. Li D. J. Nat. Prod. 2019;82:2013–2017. doi: 10.1021/acs.jnatprod.9b00345. [DOI] [PubMed] [Google Scholar]
- Moussa M. Ebrahim W. Bonus M. Gohlke H. Mándi A. Kurtán T. Hartmann R. Kalscheuer R. Lin W. Liu Z. Proksch P. RSC Adv. 2019;9:1491–1500. doi: 10.1039/C8RA09067J. [DOI] [PMC free article] [PubMed] [Google Scholar]
- Wang W. Zeng F. Bie Q. Dai C. Chen C. Tong Q. Liu J. Wang J. Zhou Y. Zhu H. Zhang Y. Org. Lett. 2018;20:6817–6821. doi: 10.1021/acs.orglett.8b02942. [DOI] [PubMed] [Google Scholar]
- Stierle A. Stierle D. Decato D. Priestley N. Alverson J. Hoody J. McGrath K. Klepacki D. J. Nat. Prod. 2017;80:1150–1160. doi: 10.1021/acs.jnatprod.7b00133. [DOI] [PMC free article] [PubMed] [Google Scholar]
- Oh D. Jensen P. Kauffman C. Fenical W. Bioorg. Med. Chem. 2005;13:5267–5273. doi: 10.1016/j.bmc.2005.05.068. [DOI] [PubMed] [Google Scholar]
- Huang S. Ding W. Li C. Cox D. G. Pharmacogn. Mag. 2014;40:410–414. doi: 10.4103/0973-1296.141781. [DOI] [PMC free article] [PubMed] [Google Scholar]
- Meng L. Liu Y. Li X. Xu G. Ji N. Wang B. J. Nat. Prod. 2015;78:2301–2305. doi: 10.1021/acs.jnatprod.5b00450. [DOI] [PubMed] [Google Scholar]
- Li H. T. Zhou H. Duan R. T. Li H. Y. Tang L. H. Yang X. Q. Yang Y. B. Ding Z. T. J. Nat. Prod. 2019;82:1009–1013. doi: 10.1021/acs.jnatprod.8b00685. [DOI] [PubMed] [Google Scholar]
- Li H. T. Tang L. Liu T. Yang R. Yang Y. Zhou H. Ding Z. T. Org. Chem. Front. 2019;6:3847–3853. doi: 10.1039/C9QO01087D. [DOI] [Google Scholar]
- Li H. T. Tang L. H. Liu T. Yang R. N. Yang Y. B. Zhou H. Ding Z. T. Bioorg. Chem. 2020;95:103503. doi: 10.1016/j.bioorg.2019.103503. [DOI] [PubMed] [Google Scholar]
- Li C. Sarotti A. M. Turkson J. Cao S. Tetrahedron Lett. 2017;58:2290–2293. doi: 10.1016/j.tetlet.2017.04.096. [DOI] [PMC free article] [PubMed] [Google Scholar]
- Jagannadh B. Reddy S. S. Thangavelu R. J. Mol. Model. 2004;10:55–59. doi: 10.1007/s00894-003-0166-5. [DOI] [PubMed] [Google Scholar]
- Berova N. Di Bari L. Pescitelli G. Chem. Soc. Rev. 2007;36:914–931. doi: 10.1039/B515476F. [DOI] [PubMed] [Google Scholar]
- Bringmann G. Bruhn T. Maksimenka K. Hemberger Y. Eur. J. Org. Chem. 2009:2717–2727. doi: 10.1002/ejoc.200801121. [DOI] [Google Scholar]
- Bruhn T., Schaumlöffel A. and Hemberger Y., SpecDis, version 1.64, University of Wüerzburg, Germany, 2015 [Google Scholar]
- Cory A. H. Owen T. C. Barltrop J. A. Cory J. G. Cancer Commun. 1991;3:207–212. doi: 10.3727/095535491820873191. [DOI] [PubMed] [Google Scholar]
- Ren Y. Gallucci J. C. Li X. Chen L. Yu J. Kinghorn A. D. J. Nat. Prod. 2018;81:554–561. doi: 10.1021/acs.jnatprod.7b01079. [DOI] [PMC free article] [PubMed] [Google Scholar]
- Mahapatra M. K. Kumar R. Kumar M. Bioorg. Chem. 2017;71:1–9. doi: 10.1016/j.bioorg.2017.01.007. [DOI] [PubMed] [Google Scholar]
- Liu F. F. Yuan T. Liu W. Ma H. Seeram N. P. Li Y. Xu L. Ma Y. Huang X. Li L. J. Nat. Prod. 2017;80:544–550. doi: 10.1021/acs.jnatprod.6b01073. [DOI] [PubMed] [Google Scholar]
Associated Data
This section collects any data citations, data availability statements, or supplementary materials included in this article.


