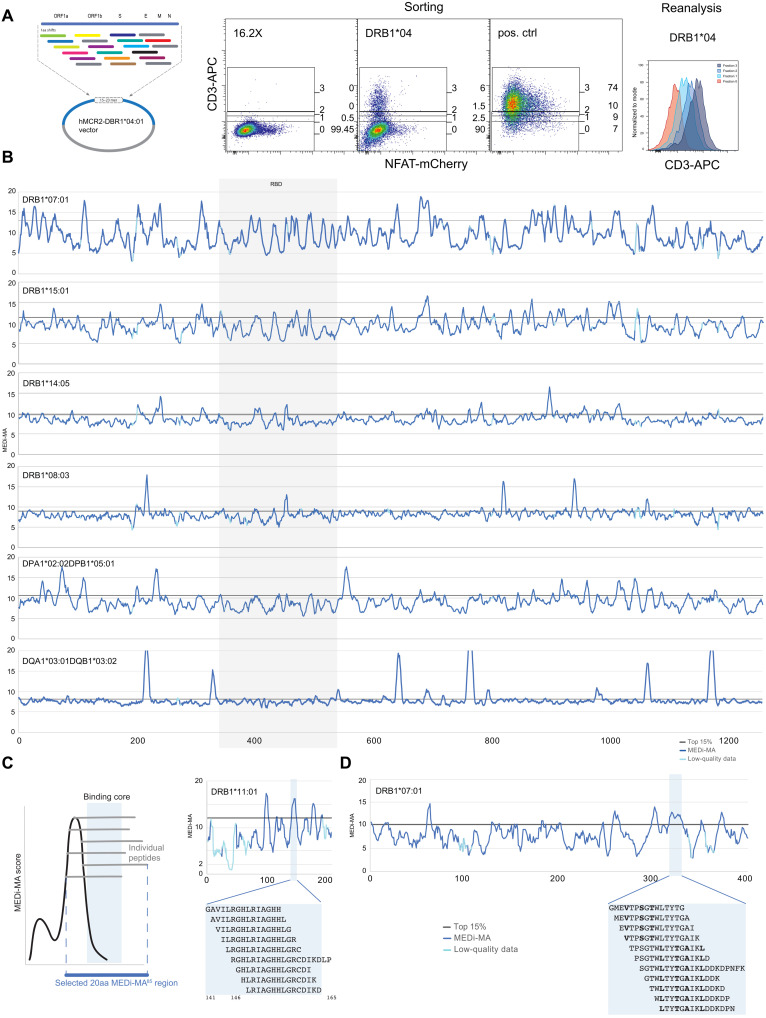
Fig. 2. MEDi analysis of Spike peptide presentability by different HLAs.
(A) Example flow cytometric analysis and sorting of MCR2+ reporter cells, transduced with an MCR2 library and stained for CD3e. On the basis of the surface expression of the MCR2, four fractions (neg, low, mid, and hi) were sorted and reanalyzed. Negative (16.2X) and positive controls are indicated. APC, allophycocyanin. (B) MEDi-MA score graphs for all Spike-derived peptides presented by six different HLAs (dark blue line) are shown. The light blue color indicates data points below the quality threshold (see Materials and Methods). (C and D) Schematics and interpretation of the MEDi graphs. MEDi analysis for the membrane (C) and nucleocapsid (D) proteins with indicated 15–amino acid peptides falling into example peaks above the 85th percentile. Putative anchor residues for DRB1*07:01 are shown in bold. The extended peptides are recognized by some TCRs analyzed in this study.

