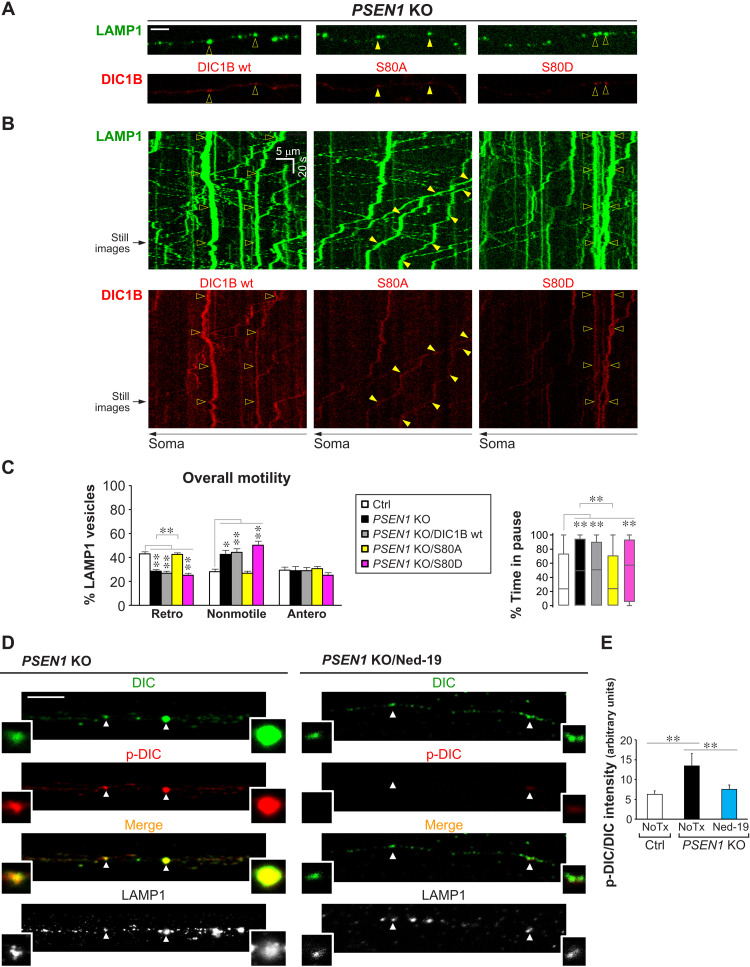
Fig. 5. DIC hyperphosphorylation mediates defective retrograde transport of LEs/amphisomes in PSEN1 KO neurons.
(A to C) Time-lapse imaging in Ctrl and PSEN1 KO axons expressing LAMP1-YFP, with or without cotransfection of DIC1B-mCherry constructs (wt, wild-type; S80A, nonphosphorylatable; S80D, phosphomimetic). (A) Representative still images (left side; proximal to soma). Scale bar, 5 μm. Closed arrowheads, retrograde; open arrowheads, nonmotile. (B) Corresponding kymographs (time = 146 s). Arrowheads show trajectories of marked vesicles in (A). (C) Quantitative analyses. Overall motility: % retrograde (retro), nonmotile (<0.1 μm/s), and anterograde (antero) LAMP1 vesicles. Bars = means + SEM (n = 8, 12, 16, 19, and 17 axons, respectively, in Ctrl, PSEN1 KO, PSEN1 KO/DIC1B wt, PSEN1 KO/S80A, and PSEN1 KO/S80D). Percent time in pause of LAMP1 vesicles is shown by Tukey’s box-and-whisker plot (n = 416, 637, 979, 1156, and 845 vesicles, respectively, in Ctrl, PSEN1 KO, PSEN1 KO/DIC1B wt, PSEN1 KO/S80A, and PSEN1 KO/S80D). (D and E) Immunofluorescent staining of DIC (AF633; pseudo-colored green), p-DIC-S80 (AF568; red), and LAMP1 (AF488; grayscale) in axonal segments of Ctrl, PSEN1 KO, and Ned-19–treated PSEN1 KO neurons grown in microfluidics devices. (D) Representative images of PSEN1 KO with or without Ned-19 treatment (see also Fig. 4C). Magnified images of vesicles marked by arrowheads are shown as insets. Color in merged images reflects the degree of DIC S80 phosphorylation. Scale bar, 5 μm. (E) Graph shows LAMP1 vesicle–associated p-DIC-S80 signal intensity normalized by DIC signal intensity. Bars = means + SEM (n = 706 vesicles from 40 Ctrl axons, 2143 vesicles from 78 PSEN1 KO axons, and 1057 vesicles from 70 PSEN1 KO/Ned-19 axons). NoTx, untreated. (C and E) *P < 0.05 and **P < 0.01, 1-way ANOVA with Holm-Sidak multiple comparisons or Kruskal-Wallis test with Dunn’s multiple comparisons.

