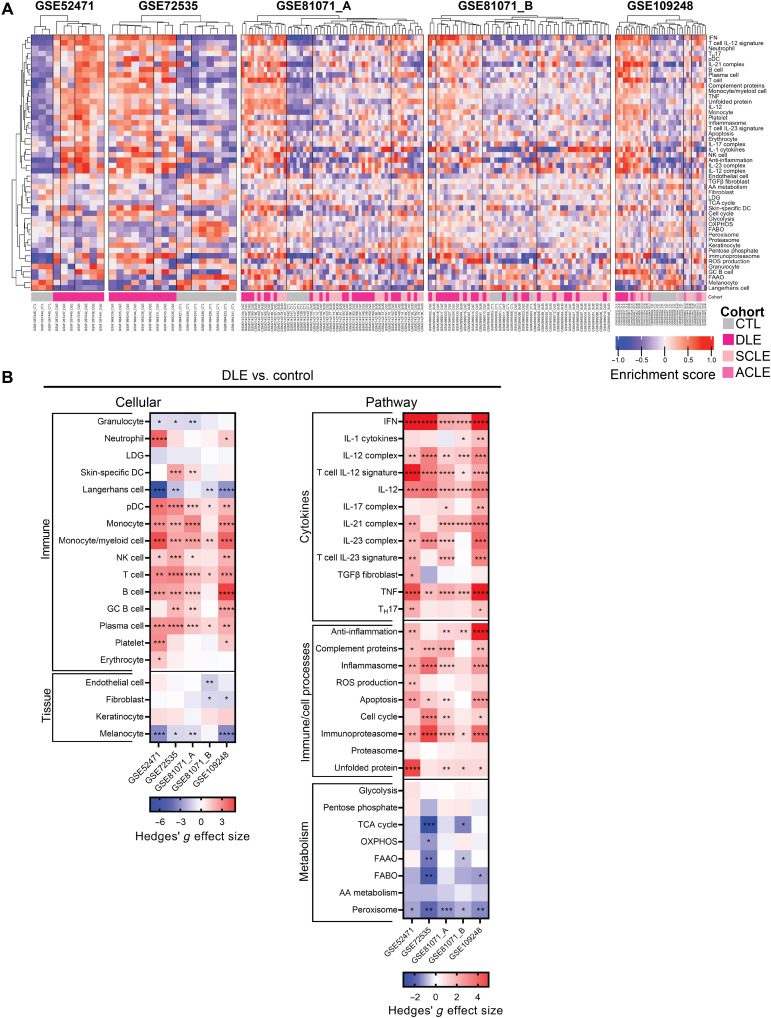
Fig. 1. DLE is characterized by enrichment of inflammatory cell and cytokine signatures, including the IFN, IL-12, and TNF signatures.
(A) Hierarchical clustering (k = 4 clusters) of DLE and healthy control samples from five lupus datasets using GSVA enrichment scores of cellular and pathway gene signatures. (B) Hedges’ g effect sizes of cellular (left) and pathway (right) gene signatures for DLE compared to healthy control samples in five lupus datasets. Heatmap visualization uses red (enriched signature, >0) and blue (decreased signature, <0). Welch’s t test: *P < 0.05; **P < 0.01; ***P < 0.001; ****P < 0.0001. AA, amino acid; FAAO, fatty acid α oxidation; FABO, fatty acid β oxidation; LDG, low-density granulocyte; OXPHOS, oxidative phosphorylation; ROS, reactive oxygen species; TCA, tricarboxylic acid.

