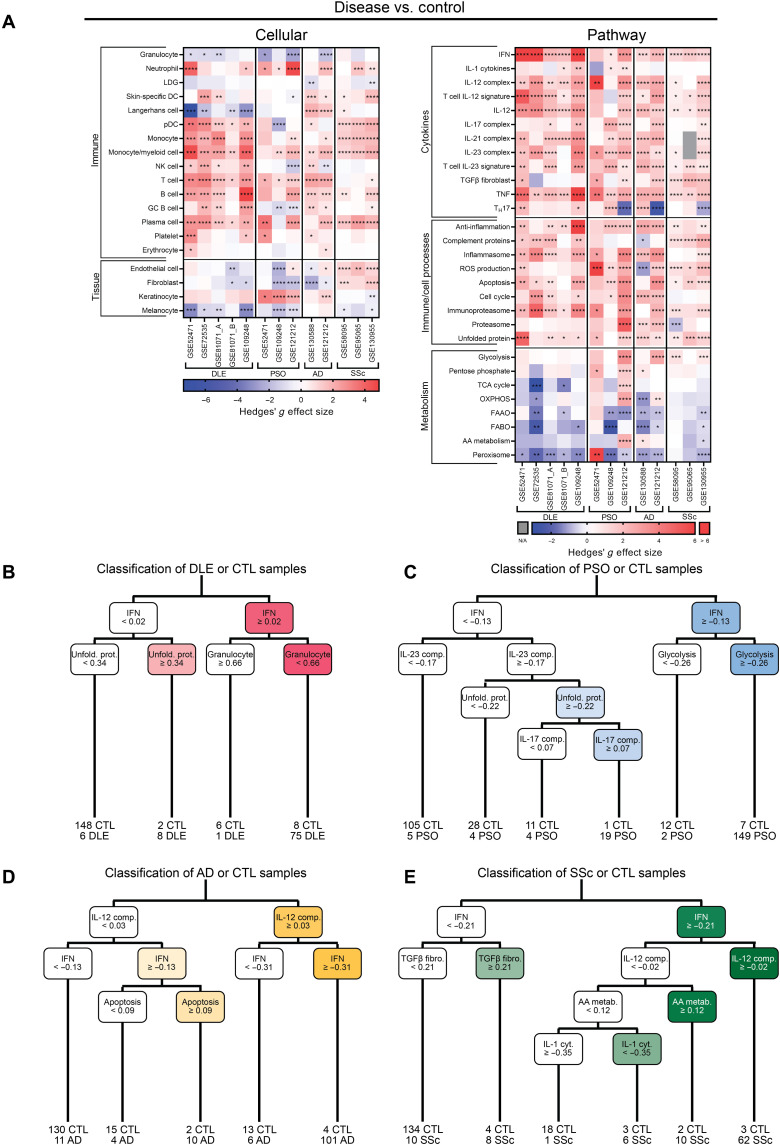
Fig. 2. Enrichment of myeloid, lymphoid, IFN, IL-12, IL-23, and TNF signatures is shared among lesional DLE, PSO, AD, and SSc.
(A) Hedges’ g effect sizes of cellular (left) and pathway (right) gene signatures for disease samples compared to their respective control samples in five DLE, three PSO, two AD, and three SSc datasets. Heatmap visualization uses red (enriched signature, >0) and blue (decreased signature, <0). Welch’s t test: *P < 0.05; **P < 0.01; ***P < 0.001; ****P < 0.0001. CART analysis for disease or control classification using GSVA enrichment scores in (B) DLE, (C) PSO, (D) AD, and (E) SSc. Sample numbers below bottom leaves represent the number of samples of each group classified into that leaf.

