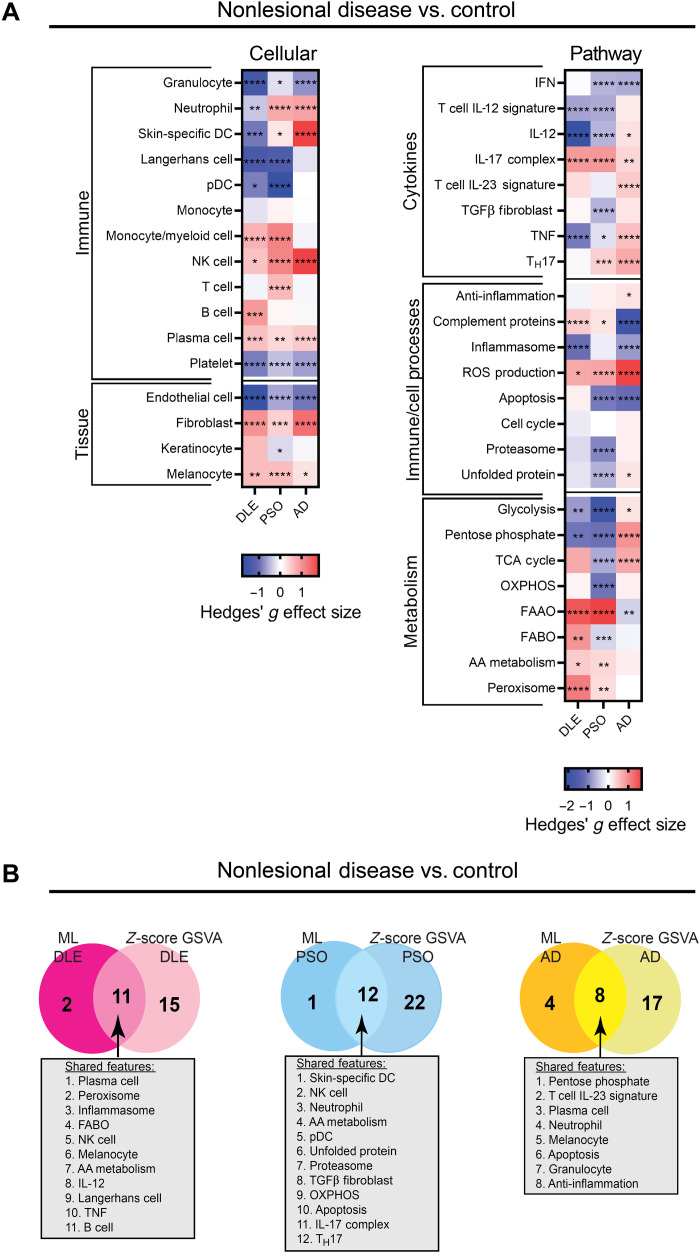
Fig. 7. Nonlesional skin is characterized by up-regulation of unique cellular and pathway signatures.
(A) Hedges’ g effect sizes of cellular (left) and pathway (right) gene signatures for pooled nonlesional disease samples compared to pooled control samples DLE, PSO, and AD datasets. Heatmap visualization uses red (enriched signature, >0) and blue (decreased signature, <0). Welch’s t test: *P < 0.05; **P < 0.01; ***P < 0.001; ****P < 0.0001. (B) Comparison of the most important features determined by ML that are also statistically significant by z-score GSVA of nonlesional skin versus controls for nonlesional DLE (left), nonlesional PSO (middle), and nonlesional AD (right). Forty signatures were used in the nonlesional z-score GSVA; only these features were used in the comparison to nonlesional ML.

