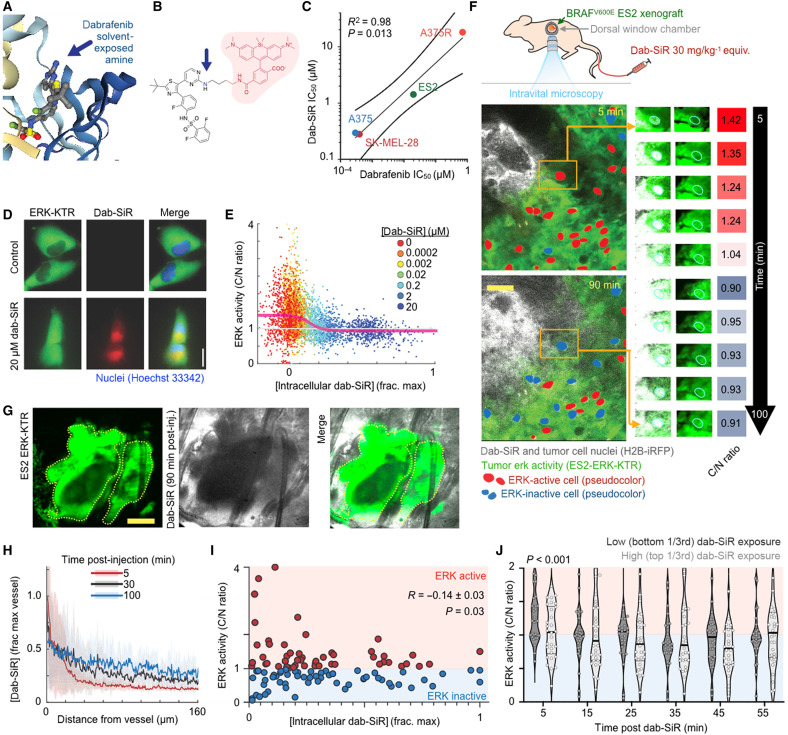
Fig. 2. Companion dabrafenib imaging reveals heterogeneous single-cell PK/PD.
(A and B) Crystal structure of dabrafenib bound to BRAFV600E (A) (Protein Data Bank: 5CSW) and corresponding design of the near-infrared companion imaging drug, dab-SiR (B). (C) Dabrafenib and dab-SiR were compared across BRAFV600E cell lines by 72-hour cytotoxicity (Pearson’s correlation and two-tailed t test reported; n = 2 reps). (D and E) Representative imaging of ES2-ERK-KTR cells treated ± dab-SiR for 2 hours (D) and corresponding cytoplasm-to-nucleus (C/N ratio) quantification (E) (n > 30 cells per condition); line denotes moving average of single-cell data. (F and G) Intravital microscopy of ES2 xenograft response to dab-SiR (30 mg/kg) using female nu/nu dorsal window chamber model at ×20 (F) (scale bar, 100 μm) and ×2 (G) (scale bar, 1 mm) magnification. Inset highlights single-cell response and corresponding quantification. (H to J) Drug concentration profile (H), ERK activity (I), and response after binning by drug exposure (J) were quantified from data as in (F). Data are means ± SE across three tumors and 90 cells. Two-way ANOVA (J) (n = 60 total cells) was used.

