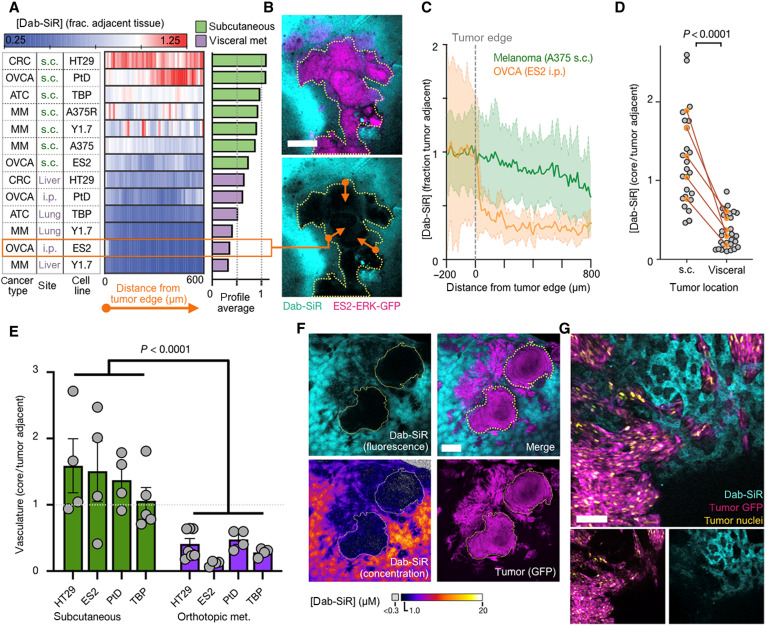
Fig. 3. Dab-SiR penetration into solid tumors correlates with anatomical context and vascularization.
(A to D) Mean radial line profiles quantify dab-SiR concentration as a function of distance from the tumor edge (A) (n ≥ 2 tumors per model), with representative omentum metastasis from ES2 (B) (scale bar, 100 μm) and individual line profiles (C) (thick line and shading denote means ± SE). Orange arrows illustrate radial profiles (multiple averaged per tumor). (D) Using models as in (A), dab-SiR was quantified in tumor center regions versus adjacent tissue, shown as individual tumor measurements (gray) and average values for matched subcutaneous (s.c.) and visceral metastasis models (two-tailed t test). i.p., intraperitoneally. (E) Corresponding to images as in (A), lectin was quantified in tumor center regions versus adjacent tissue, shown as individual tumor measurements (gray) and average values for matched subcutaneous and visceral metastasis models (P < 0.001, two-way ANOVA; n = 36 total tumors). (F and G) Confocal microscopy of dab-SiR in YUMMER1.7 (Y1.7) melanoma tumors in the liver at ×2 (F) (scale bar, 1 mm) and ×20 (G) (scale bar, 100 μm) magnification.

