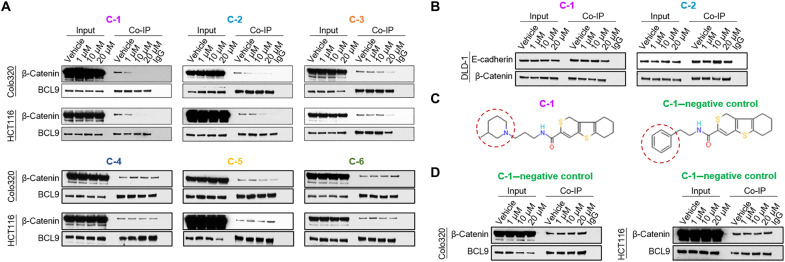
Fig. 2. In vivo β-catenin/BCL9 complex formation in response to lead compounds.
(A) Immunoblots from BCL9 Co-IP assays of Colo320 and HCT116 cell lines, treated with vehicle, C-1, C-2, C-3, C-4, C-5, or C-6. Input samples (2%) are shown on the left-hand side of each panel. Samples incubated with normal rabbit immunoglobulin G (IgG) antibody are shown on the right-hand side of each panel. (B) Immunoblots from β-catenin Co-IP assays of the DLD-1 cell line, treated with vehicle, and two top-performing compounds (C-1 and C-2). Input samples (2%) are shown on the left-hand side of each panel. Samples incubated with normal rabbit IgG antibody are shown on the right-hand side of each panel. (C) The chemical structures of compound C-1 and the C-1–negative control. The red dashed circles highlight the part of the structure that differs in these two compounds. (D) Immunoblots from BCL9 Co-IP assays of Colo320 and HCT116 cell lines, treated with vehicle or increasing concentrations of the C-1–negative control compound. Input samples (2%) are shown on the left-hand side of each panel. Samples incubated with normal rabbit IgG antibody are shown on the right-hand side of each panel.

