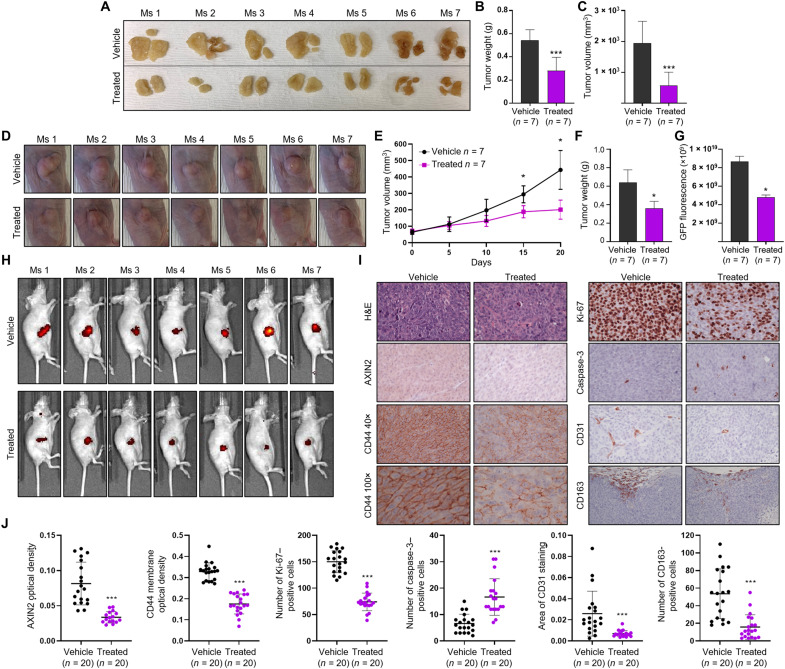
Fig. 7. The effect of C-1 on tumor growth in a xenograft mouse model of CRC.
(A) Images of dissected tumors from mice treated with vehicle (n = 7) or C-1 (n = 7) via intraperitoneal injections. (B and C) Tumor weight and tumor volume of mice treated with vehicle (n = 7) or C-1 (n = 7) via intraperitoneal injections. Error bars represent means ± SD. (D) Images of subcutaneous tumors, taken on day 20 of the study, from mice treated with vehicle (n = 7) or C-1 (n = 7) via intratumoral injections. (E) Body weight (top) and tumor volume (bottom) of mice treated with vehicle (n = 7) or C-1 treated (n = 7) via intratumoral injections. Error bars represent means ± SD. (F and G) Tumor weight and tumor GFP fluorescence measurements recorded from mice treated with vehicle (n = 7) or C-1 (n = 7), via intratumoral injections. Error bars represent means ± SD. (H) GFP fluorescence images of intratumoral vehicle and C-1–treated mice taken on day 20. (I) Representative hematoxylin and eosin (H&E) and IHC stains of AXIN2, CD44, Ki-67, cleaved caspase-3, CD31, and CD163 in tumor tissue from intratumoral vehicle- and C-1–treated mice. Scale bars, 50 μm. (J) Quantification of AXIN2, CD44, Ki-67, CD31, cleaved caspase-3, and CD163 immunostains in the tumors of intratumoral vehicle- and C-1–treated mice. Plots represent individual data points with error bars representing means ± SD. *P > 0.05 and ***P > 0.001.

