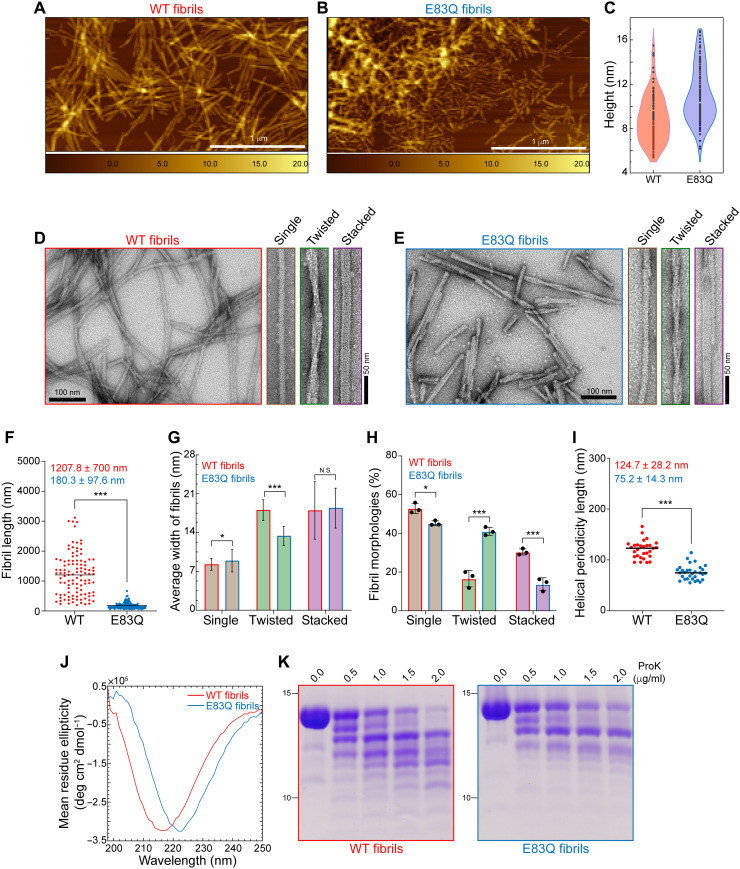
Fig. 3. E83Q aSyn forms fibrils with distinct morphological and structural properties compared with WT fibrils.
(A and B) AFM images of WT (A) and E83Q (B) aSyn fibrils. (C) Violin plot showing the height analysis (WT, 8.9 ± 2.1 nm; E83Q, 10.9 ± 2.5 nm) estimated from (A) and (B). Scale bars, 1 μm. (D and E) TEM images of WT (D) and E83Q (E) aSyn fibrils. TEM montages in (D) and (E) show the single, twisted, and stacked morphologies. Scale bars, 50 or 100 nm. (F) Dot plot showing the length distribution of WT and E83Q fibrils (n = 108 for WT; n = 191 for E83Q fibrils). ***P < 0.0005 (unpaired t test, WT versus E83Q fibrils). (G) Bar graph of TEM-based analysis of average width of different morphologies of WT and E83Q fibrils. WT fibrils [single, 8.2 ± 1.0 nm (n = 87); twisted, 18.0 ± 1.9 nm (n = 30); stacked, 17.9 ± 5.2 nm (n = 47)] and E83Q fibrils [single, 8.8 ± 2.0 nm (n = 79); twisted, 13.3 ± 1.8 nm (n = 68); stacked, 18.4 ± 3.6 nm (n = 29)]. *P < 0.05 and ***P < 0.0005 (unpaired t test, WT versus E83Q fibrils). N.S., nonsignificant. (H) Bar graph displays the distribution of different fibril morphologies between WT and E83Q. The graph represents the mean ± SD of three independent experiments. Two-way analysis of variance (ANOVA) shows a significant statistical interaction between the WT versus E83Q mutation and their different morphological distributions. Multiple comparison analysis with Sidak’s correction. *P < 0.05 and ***P < 0.001. (I) Dot plot showing the helical periodicity length of twisted fibrils of WT and E83Q aSyn (n = 30 for WT; n = 31 for E83Q fibrils). ***P < 0.0005 (unpaired t test, WT versus E83Q fibrils). (J) CD spectra of WT and E83Q aSyn fibrils. (K) SDS-PAGE analysis of proteinase K (ProK) digestion of WT (left) and E83Q (right) aSyn fibrils.

