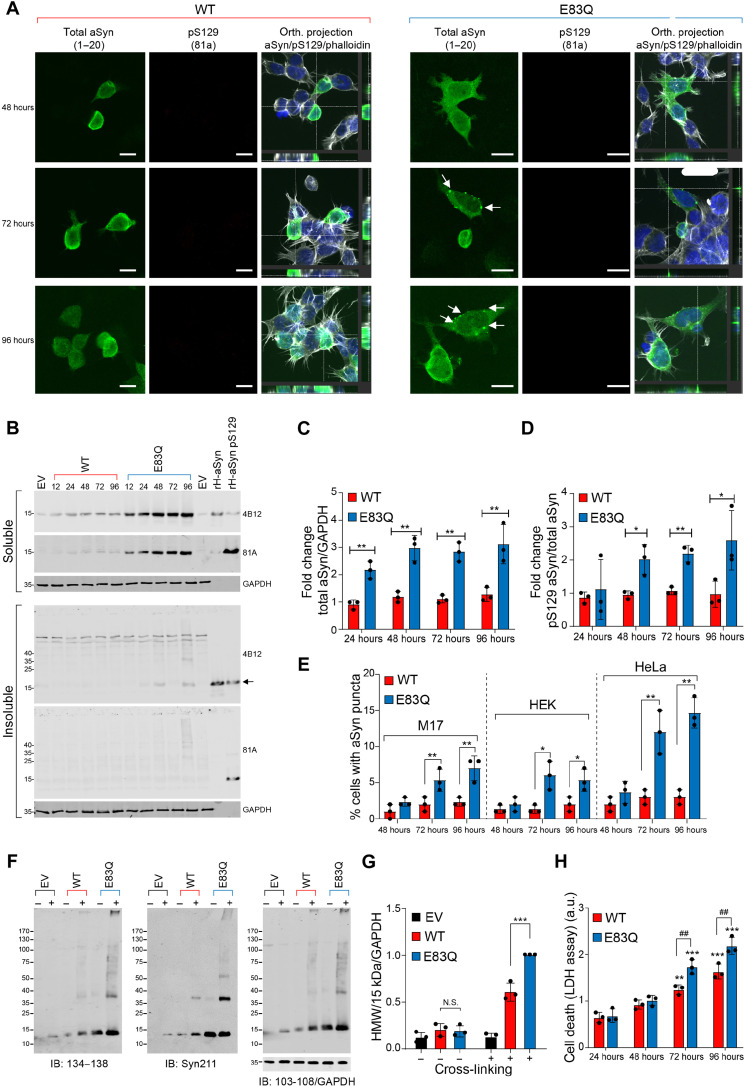
Fig. 5. Overexpression of E83Q aSyn in immortal mammalian cells does not significantly alter cellular properties.
(A) ICC of M17 cells transfected with either WT or E83Q aSyn plasmids for the indicated time. The aSyn inclusions were not detected in these cells (larger fields of view are depicted in fig. S6H). White arrows, puncta-like structures. Scale bars, 10 μM. (B) WB of soluble and insoluble fractions of M17 cells transfected with either WT or E83Q aSyn for the indicated time. Arrows indicate the low concentration of aSyn in the insoluble fractions from E83Q-expressing cells. GAPDH, glyceraldehyde-3-phosphate dehydrogenase. (C) Graph showing the expression levels of total WT and E83Q aSyn from the M17 soluble fractions. (D) Graph showing the pS129 levels in WT and E83Q aSyn expressing M17 soluble fraction. (E) Graph showing the percentage of cells with WT and E83Q aSyn puncta [as indicated in (A) by white arrows] from all three mammalian cell lines. *P < 0.05, **P < 0.05, and ***P < 0.0005 (ANOVA followed by Tukey post hoc test, WT versus E83Q at each time point). (F) WB of the cross-linking [disuccinimidyl glutarate (DSG)] of HeLa cells overexpressing either an EV, WT, or E83Q aSyn. IB, immunoblot. (G) Graph showing the quantification of high–molecular weight (HMW) aSyn bands detected at and above 25 kDa to the top of the gel from (F). N.S., nonsignificant; ***P < 0.0005 [ANOVA followed by Tukey post hoc test, nontreated cells (WT versus E83Q) and treated cells with DSG (WT+ versus E83Q+)] in both cell lines. “+” cells were treated with DSG; “–” cells were treated with dimethyl sulfoxide (DMSO). (H) Graph displaying the aSyn-mediated toxicity measured by quantifying the concentration of lactate dehydrogenase (LDH) released into the HeLa cell culture media at the indicated times. *P < 0.05 [ANOVA followed by Tukey post hoc test (WT versus E83Q)]. (C to E, G, and H) Data represent means ± SD of a minimum of three independent experiments. ##P < 0.005.

