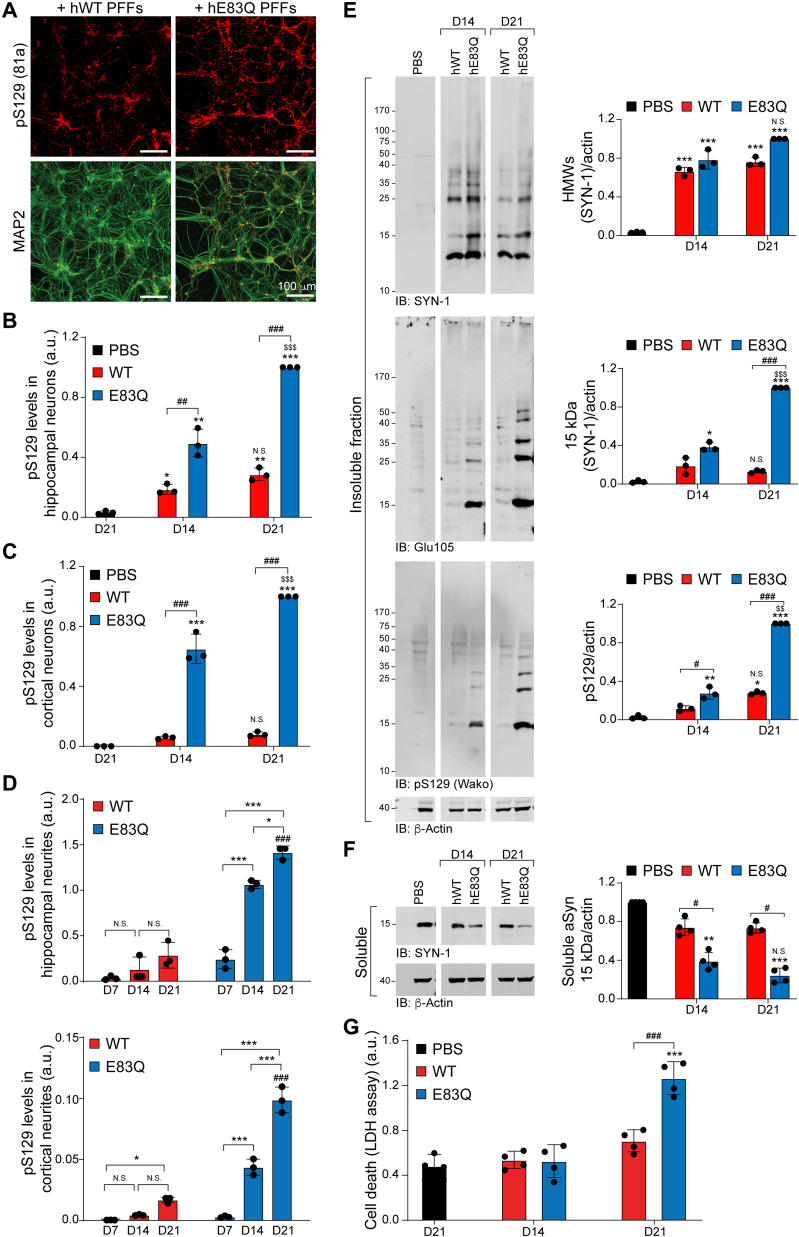
Fig. 7. hE83Q PFFs have a higher seeding capacity than hWT PFFs in WT hippocampal and cortical primary neurons.
WT hippocampal (A, B, and D to G) or cortical (C and D) neurons were treated with 70 nM hWT or hE83Q aSyn PFFs. Control neurons were treated with PBS. (A to C) The level of seeded aggregates was measured at D14 and D21 in PBS- or PFF-treated hippocampal (A and B) or cortical (C) neurons [microtubule-associated protein 2 (MAP2) positive] by HCA. Seeded aggregates were detected by ICC using pS129 (81a) antibody; neurons were counterstained with the microtubule-associated protein (MAP2) antibody; and nuclei were counterstained with 4′,6-diamidino-2-phenylindole (DAPI). Scale bars, 100 μm. For each independent experiment, a minimum of two wells was acquired per condition, and nine fields of view were imaged per well. (D) HCA analyses measuring the level of pS129 intensity in the neurites of the hippocampal neurons (top) and the cortical neurons (bottom). Segmentation of the neurites and quantification of the LN-like pathology were performed as previously described (14). (E and F) WB of total aSyn, pS129, and actin detected by SYN-1, Glu105 (antibody specific for the detection of mouse aSyn), pS129 Wako, or pS129 MJFR13 antibodies, respectively. In the insoluble fraction, HMW bands corresponding to the newly formed fibrils are detected from 25 kDa up to the top of the gel. (G) Cell death levels were assessed at D14 and D21 in PBS- and PFF-treated hippocampal neurons using LDH release assay. For each independent experiment, triplicate wells were measured per condition. (B to G) The graphs represent means ± SD of a minimum of three independent experiments. ANOVA followed by Tukey post hoc test was performed. *P < 0.05, **P < 0.005, and ***P < 0.0005 (PBS versus PFF). #P < 0.05 and ###P < 0.0005 (hWT versus hE83Q). $$P < 0.005 and $$$P < 0.0005 (D14 versus D21). N.S., nonsignificant (D14 versus D21).

