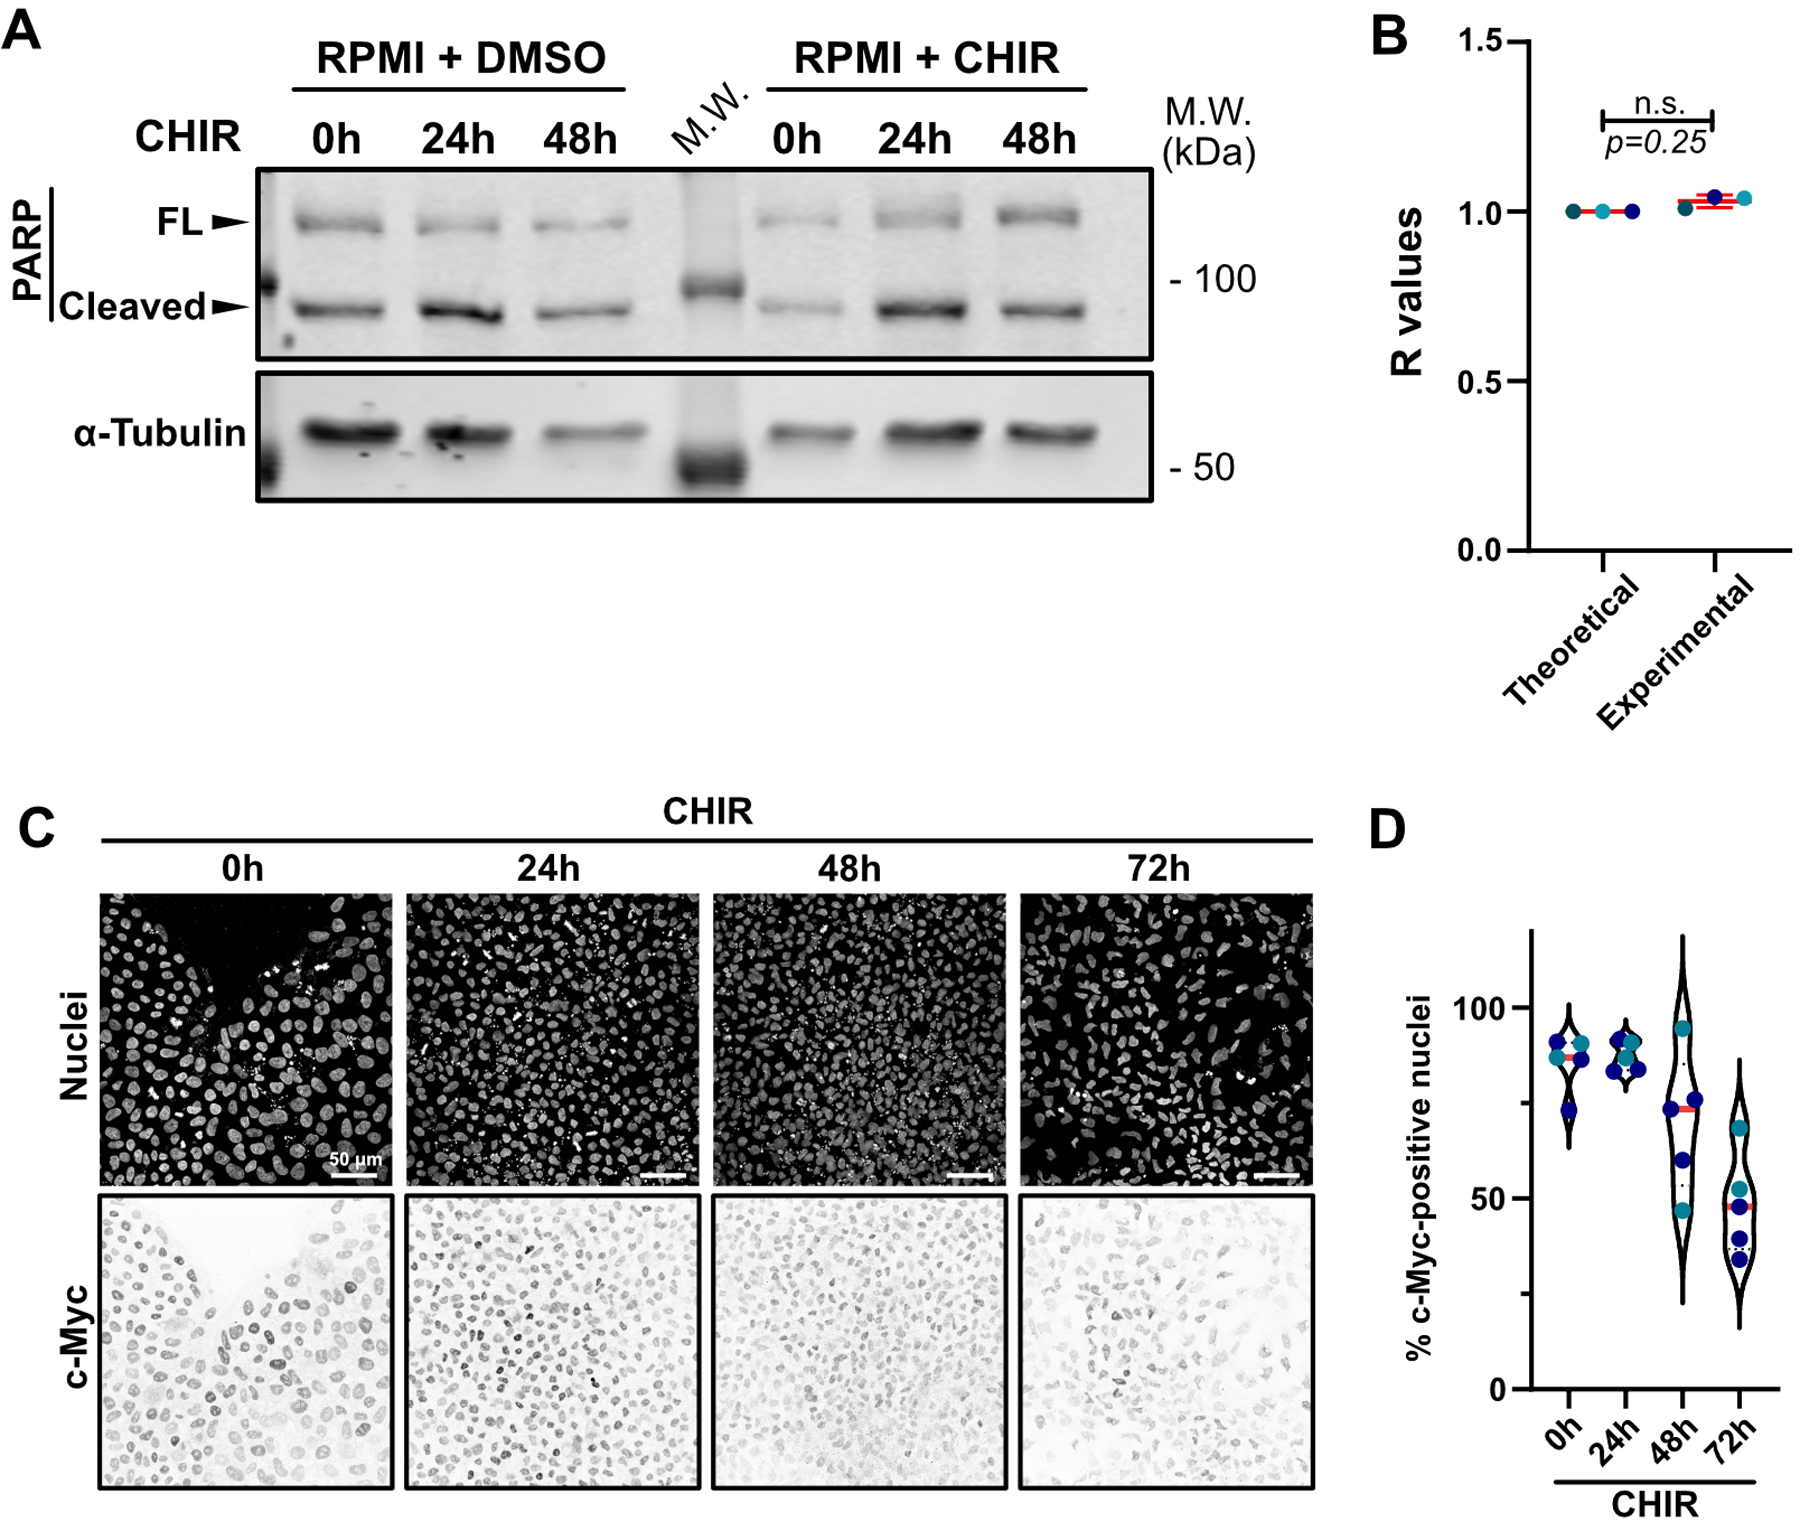
Extended Data Fig. 2. bFGF withdrawal induces apoptosis randomly across the cell population.

A) Representative immunoblot of PARP cleavage of hiPSCs treated with RPMI/B27(-Ins) supplemented or not with CHIR and collected at the indicated time. Molecular weights (M.W.) are indicated in kDa.
B) Clark-Evans analysis was used to measure randomness of cell death events after 24hrs CHIR treatment (See Methods). Cleaved Caspase-3 staining distribution was analyzed and compared to a theorical random distribution (R=1). R values closer to 0 have a tendency towards clustering while R values closer to 2 represent a tendency towards regularity. Two-tailed Wilcoxon Signed Rank Test (N=3 independent experiments).
C-D) Representative Max IPs pictures of hiPSC treated with CHIR and stained for nuclei and c-Myc. Scale bar = 50 μm (C). c-Myc expression was analyzed and presented as violin plots (Median: plain red line – Quartiles: black dotted lines). Independent biological repeats are color-coded (N=5 random fields of view obtained from 2 independent experiments) (D).
Source numerical data and unprocessed blots are available in source data
