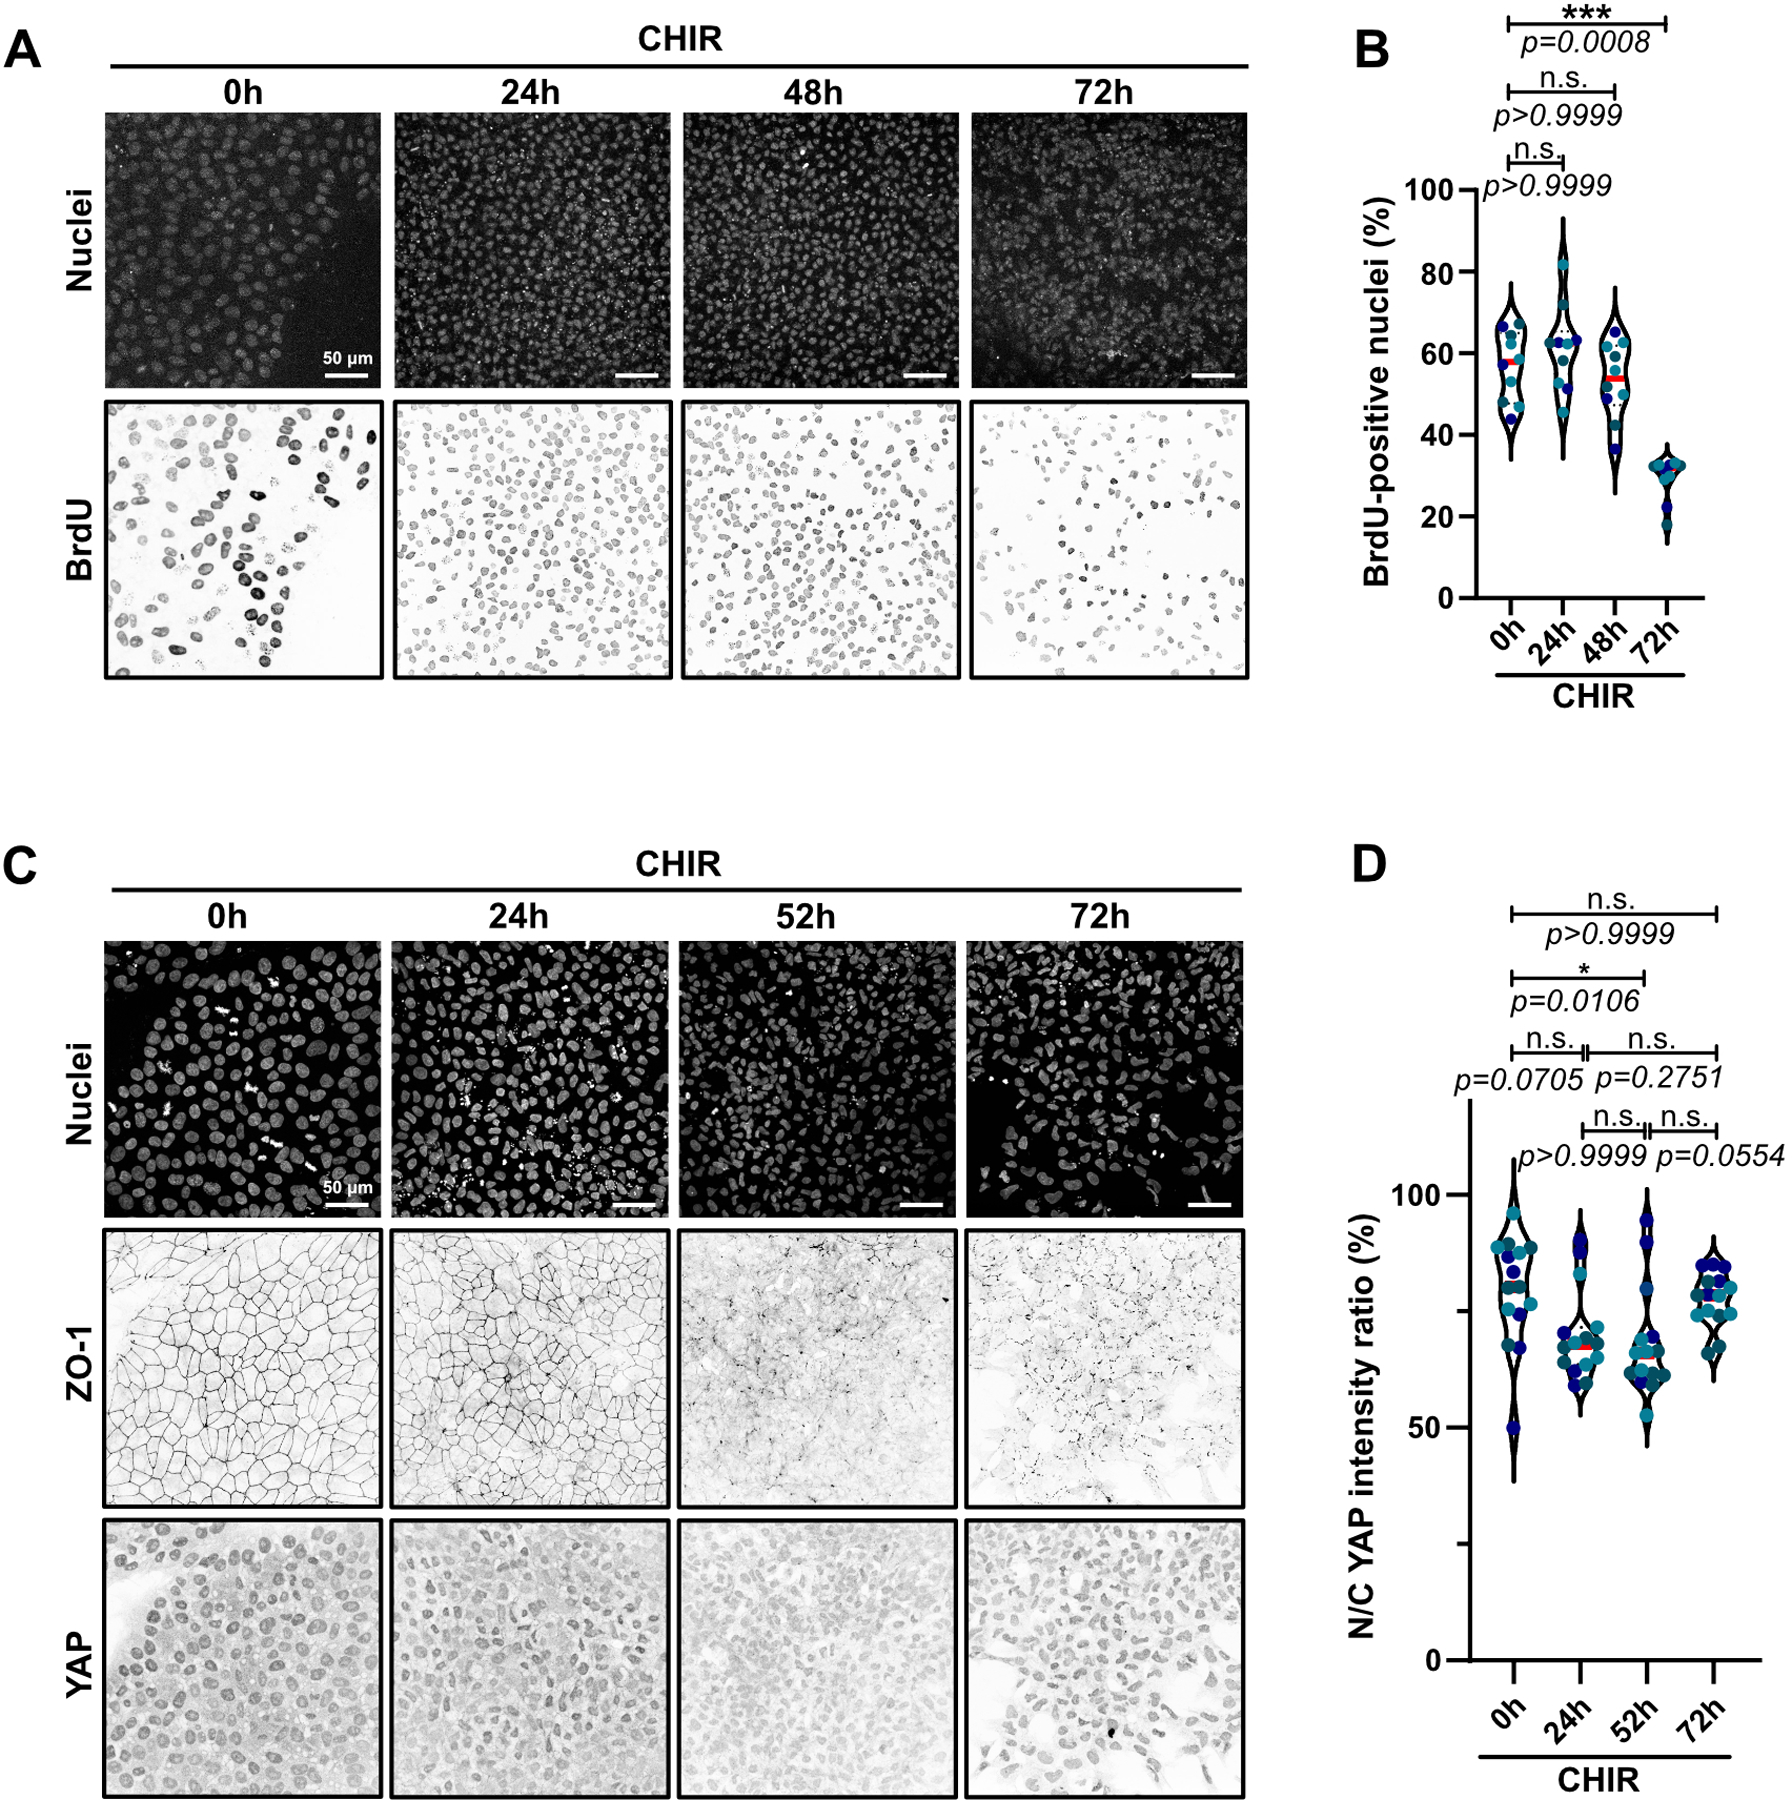
Extended Data Fig. 3. Density-dependent pathways do significantly promote EMT.

A-B) Representative Max IPs pictures of hiPSC treated with CHIR and BrdU 1h prior to fixation. Cells were stained for nuclei and BrdU to assess cell proliferation. Scale bar = 50 μm (A). BrdU incorporation was analyzed and presented as violin plots (Median: plain red line – Quartiles: black dotted lines). Independent biological repeats are color-coded (N=10 random fields of view obtained from 3 independent experiments). Dunn’s multiple comparisons test was applied. (B).
C-D) Representative Max IPs pictures of hiPSC treated with CHIR and stained for nuclei, ZO-1 and YAP. Scale bar = 50 μm (C). Nuclear-to-cytosolic ratio of YAP was analyzed and presented as violin plots (Median: plain red line – Quartiles: black dotted lines). Independent biological repeats are color-coded (N=15 random fields of view obtained from 3 independent experiments). Dunn’s multiple comparisons test was applied (D).
Source numerical data are available in source data
