
Extended Data Fig. 4. Apoptosis is required for EMT and cardiac differentiation.
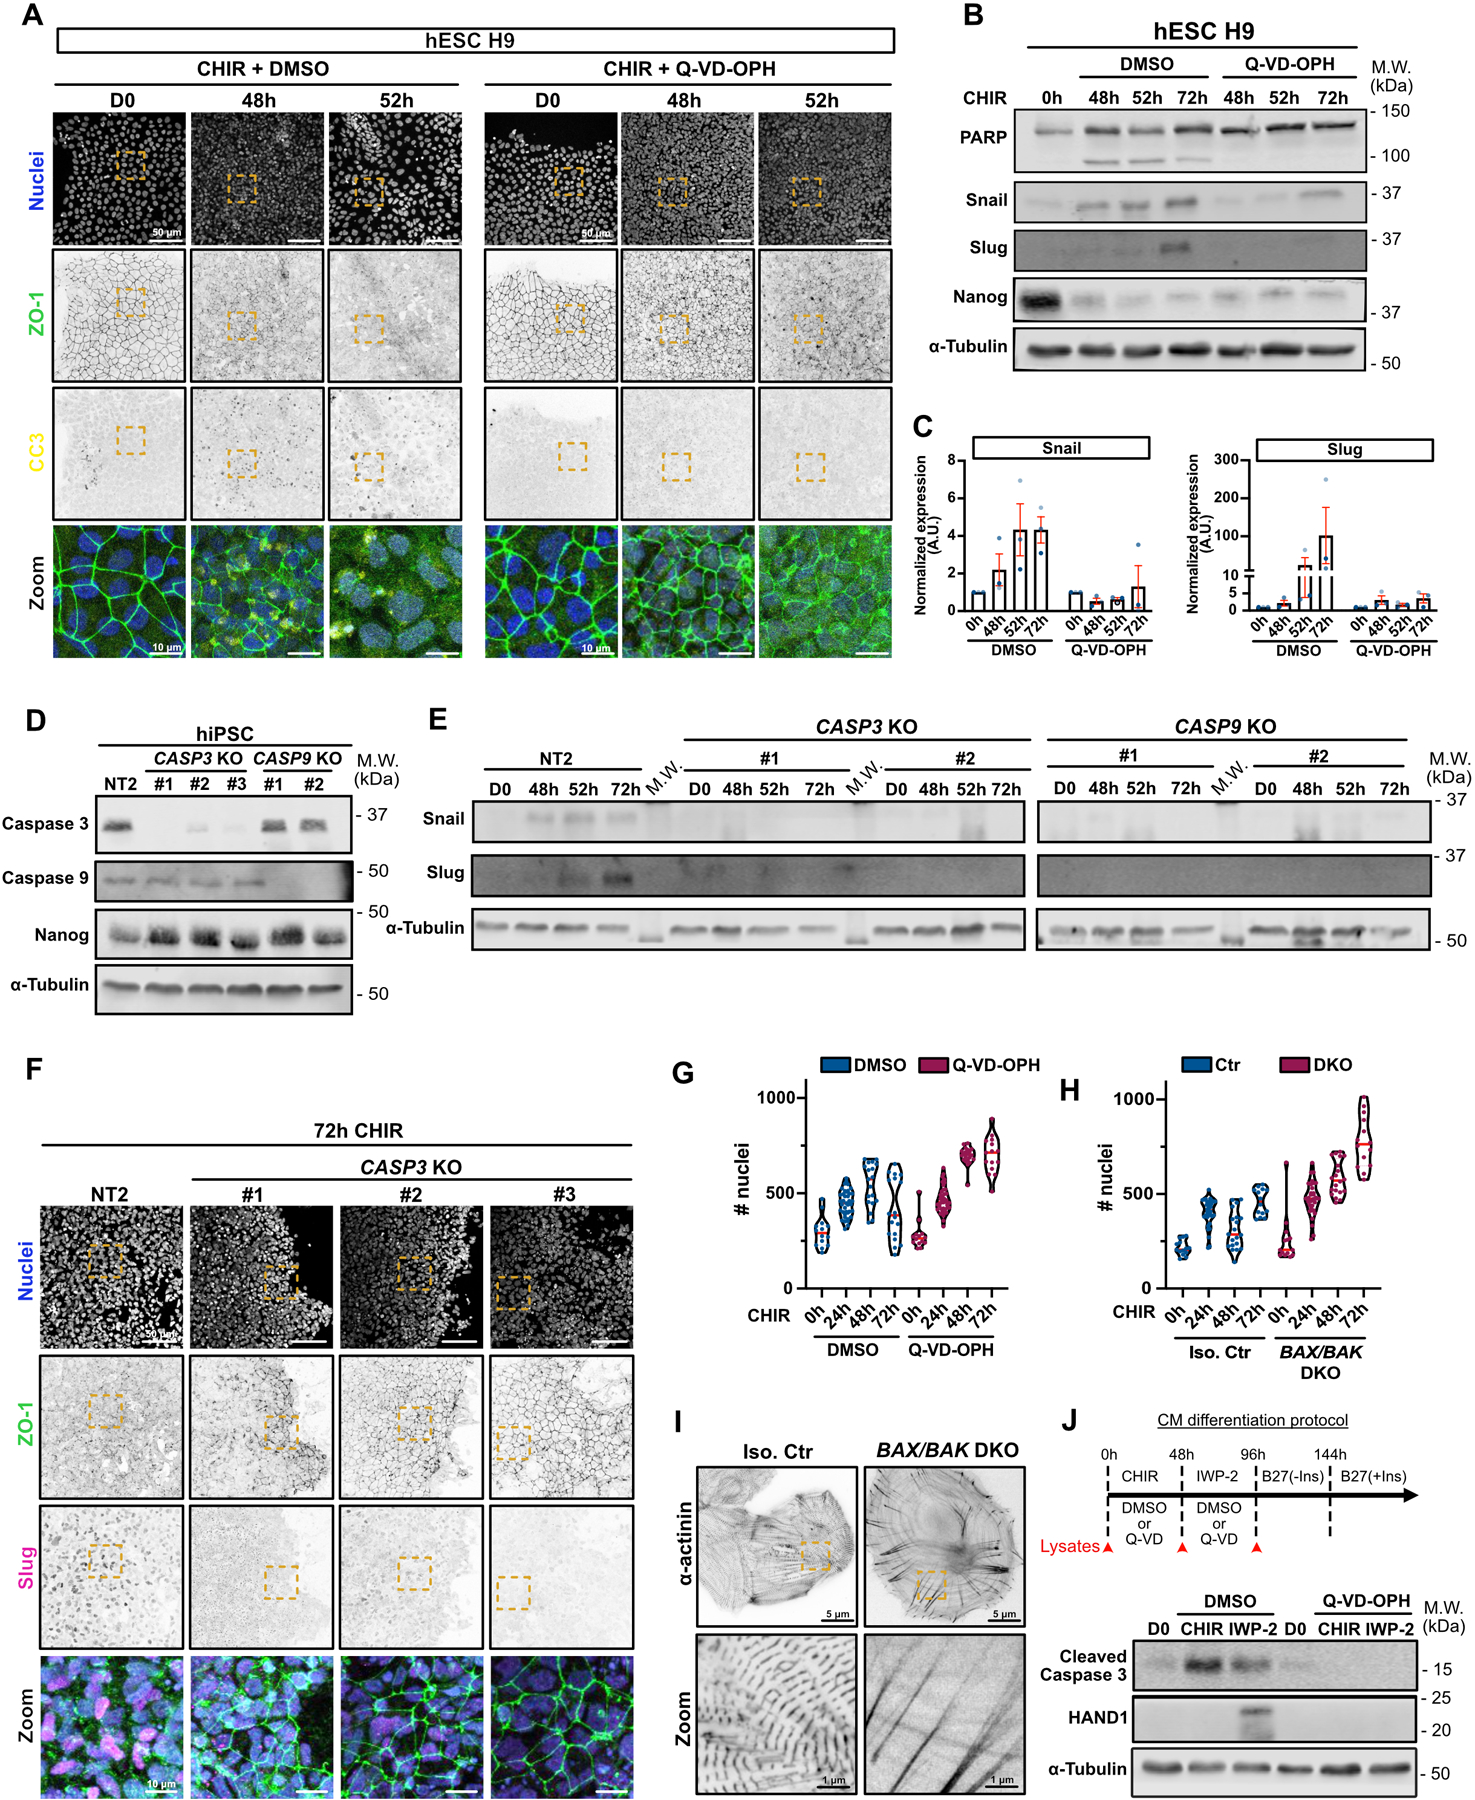
A) Representative Max IPs images of hESC H9 co-treated with CHIR + DMSO (left) or CHIR + 10 μM Q-VD-OPH (right) stained for ZO-1 (green), cleaved caspase 3 (yellow) and nuclei (blue). Scale bar = 50 μm. Magnified area (yellow dotted square) is shown as a merge. Scale bar = 10 μm.
B-C) Immunoblot analysis of hESC H9 co-treated with CHIR + DMSO or 10 μM Q-VD-OPH. Molecular weights (M.W.) are indicated in kDa (B). Normalized expression of Snail and Slug was quantified by densitometry across 3 independent biological replicates (color-coded). Mean +/− S.E.M. (C).
D) Immunoblot of CASP3 and CASP9 KO cell lines (non clonal). Knockout validation was performed by probing for Caspase 3 and Caspase 9 expression, as well as Nanog as a stem cell marker. Molecular weights (M.W.) are indicated in kDa.
E) Immunoblot of control Non Targeted (NT2) and CASP3 and CASP9 KO cell lines, analyzed for Snail and Slug expression upon CHIR induction. Molecular weights (M.W.) are indicated in kDa.
F) Representative Max IPs images of Non targeted (NT2) and CASP3 KO hiPSCs, induced 72hrs with CHIR and stained for ZO-1 (green), Slug (magenta) and nuclei (blue). Scale bar = 50 μm. Magnified area (yellow dotted square) is shown as a merge. Scale bar = 10 μm.
G-H) Violin plots representing numbers of nuclei over time for WT hiPSCs co-treated with CHIR +/− Q-VD-OPH (G) or BAX/BAK DKO hiPSCs treated with CHIR. (Median: plain red line – Quartiles: black dotted lines). Three independent biological repeats are color-coded (Number of fields of view: DMSO 0hrs N=14, DMSO 24hrs N=39, DMSO 48hrs N=19, DMSO 72hrs N=18, Q-VD 0hrs N=14, Q-VD 24hrs N=39, Q-VD 48hrs N=21, Q-VD 72hrs N=15) (Number of fields of view Ctr 0hrs N=14, Ctr 24hrs N=34, Ctr 48hrs N=20, Ctr 72hrs N=14, DKO 0hrs N=14, DKO 24hrs N=33, DKO 48hrs N=20, DKO 72hrs N=14).
I) SIM images of isogenic control and BAX/BAK DKO hiPSC-derived cardiomyocytes, plated at low density and stained for alpha-actinin. Scale bar = 5 μm. Magnified area (yellow dotted square) is shown. Scale bar = 1 μm.
J) Immunoblot analysis of hiPSC treated with CHIR and IWP-2 co-treated or not with 10 μM Q-VD-OPH and probed for cleaved Caspase-3 and cardiac marker HAND1. Cell lysates were collected as indicated on the timeline (red arrows).
Source numerical data and unprocessed blots are available in source data.