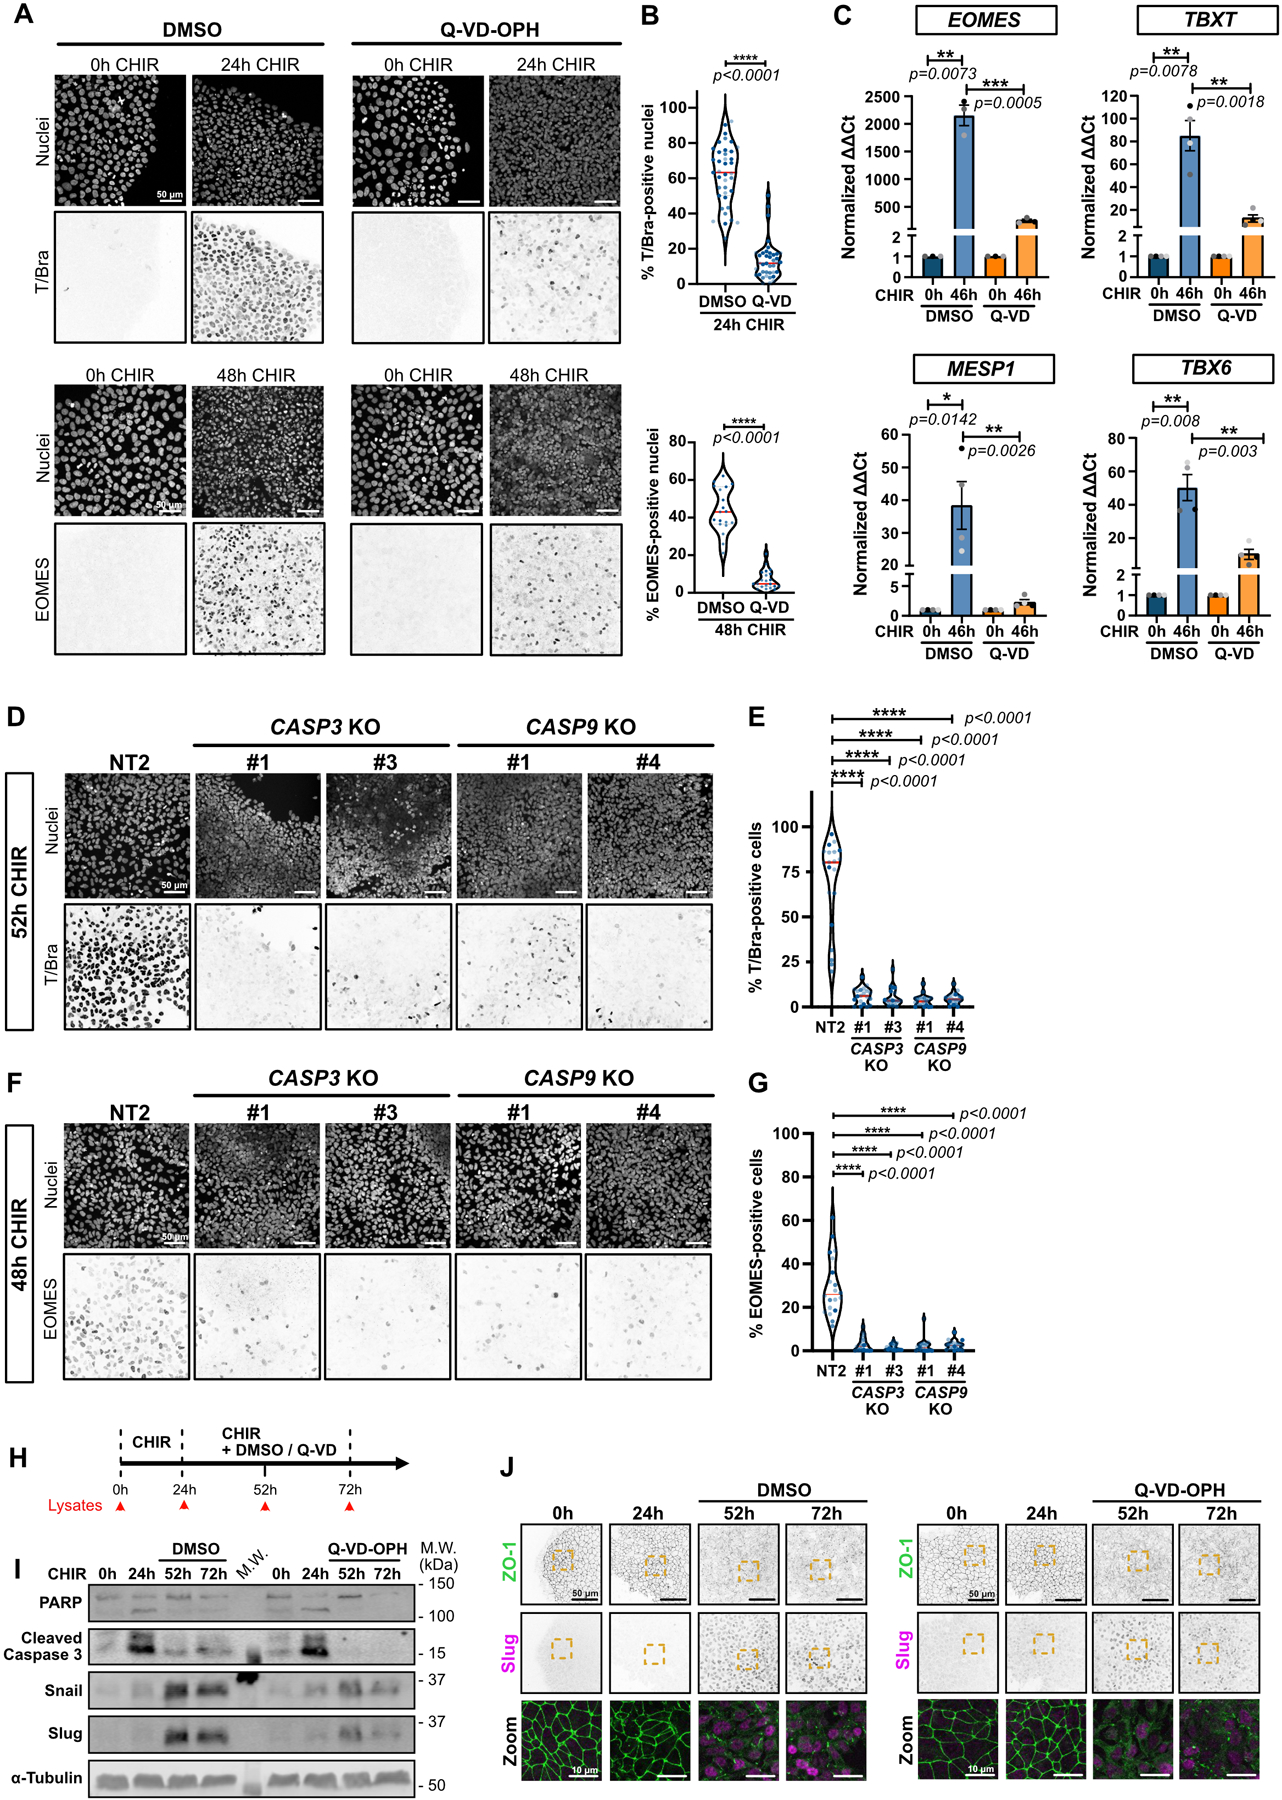
Extended Data Fig. 5. Apoptosis is required early in selection of mesoderm lineage.

A-B) Representative Max IPs images of hiPSCs stained for T/Bra (top) and EOMES (bottom) and nuclei, before (0hrs) and after CHIR treatment +/− Q-VD-OPH. Scale bar = 50 μm. (A). Violin plots summarize quantification of the percentage of T/Bra-positive (top) and EOMES-positive (bottom) nuclei after CHIR treatment (Median: plain red line – Quartiles: black dotted lines). Independent biological repeats are color-coded (N=19 and 21 random fields of view for EOMES staining in DMSO and Q-VD-treated cells respectively, obtained from 2 independent experiments and N=39 random fields of view for T/Bra staining, obtained from 3 independent experiments). Two-tailed Mann-Whitney test was applied.
C) Relative gene expression of EOMES, TBXT, MESP1, TBX6 obtained from WT hiPSCs, induced or not with CHIR and DMSO or CHIR and Q-VD-OPH for 46hrs and analyzed by qRT-PCR. ΔΔCt values were normalized to un-induced cells. Independent biological repeats are color-coded (N=3 independent experiments for EOMES and N=4 independent experiments for the remaining data set). Error bar = Mean +/− S.E.M. Two-tailed paired t-test was applied to compare 0hrs vs 46hrs and unpaired t-test was applied to compare DMSO vs Q-VD.
D-G) Representative Max IPs images of control NT2, CASP3 and CASP9 KO hiPSCs stained for T/Bra (D), EOMES (F) and nuclei after CHIR treatment. Scale bar = 50 μm. Percentage of T/Bra-positive (E) and EOMES-positive (G) nuclei after CHIR treatment are shown as violin plots (Median: plain red line – Quartiles: black dotted lines). Independent biological repeats are color-coded (N=20 random fields of view obtained from 3 independent experiments). Kurskal-Wallis test was applied.
H) Timeline for the Q-VD-OPH treatment and lysate collection/fixation time points. hiPSCs were treated with CHIR only for 24hrs, before adding CHIR +/− 10 μM Q-VD-OPH for another 28hrs and 48hrs with CHIR (52hrs and 72hrs time point respectively).
I) Immunoblot analysis of hiPSCs treated as presented in (H) and probed for EMT markers (Snail and Slug) and cell death markers (PARP and cleaved Caspase-3). Molecular weights (M.W.) are indicated in kDa.
J) Representative Max IPs images of hiPSCs treated as presented in (H) and stained for ZO-1 (green) and Slug (magenta). Scale bar = 50 μm. Magnified area (yellow dotted square) is shown as a merge (bottom row). Scale bar = 10 μm.
Source numerical data and unprocessed blots are available in source data
