Figure 2.

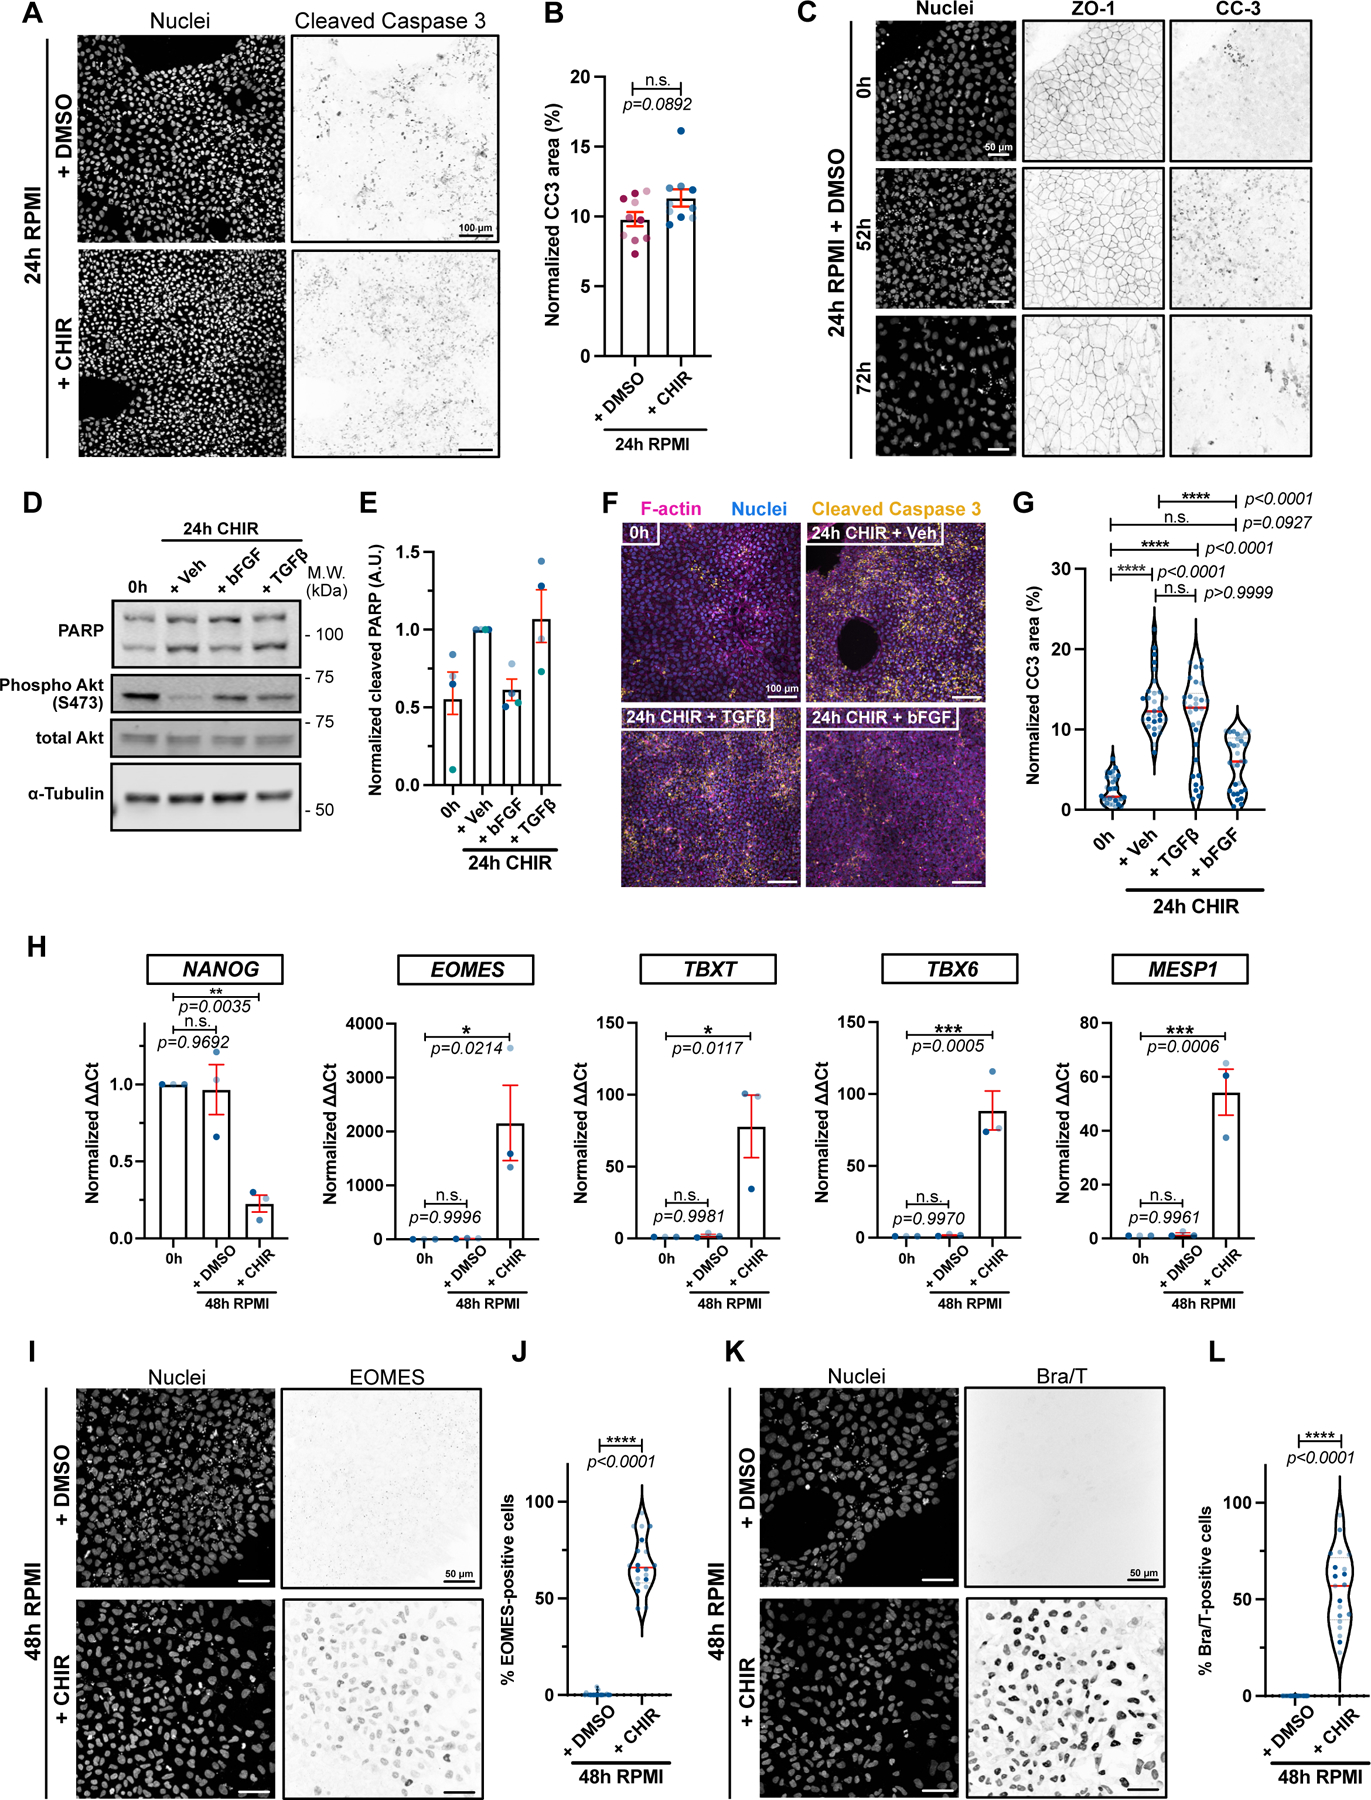
A-B) Max IPs of hiPSCs treated with RPMI/B27(-Ins.) +/− CHIR for 24hrs and stained for DNA and cleaved Caspase-3. Scale bar = 100μm (A). Cleaved Caspase staining was normalized to total cell area and shown in bar graph. Independent biological repeats are color-coded (N=10 random fields of view obtained from 3 independent biological repeats). Error bar = S.E.M. Mann-Whitney test was applied (two-tailed) (B).
C) Max IPs of hiPSCs treated with RPMI/B27(-Ins.) + DMSO and stained for DNA, ZO-1 and cleaved Caspase-3 at the indicated times. Scale bar = 50μm. (N=3 independent experiments).
D-E) Immunoblot of untreated hiPSCs (0h) or treated with RPMI/B27(-Ins) plus 20ng/mL bFGF, 1ng/mL TGFβ or Vehicle for 24hrs. Akt activation (Phospho-Akt S473) a positive control following growth factor addition (D). Ratio of cleaved/full length PARP is quantified (E). Biological repeats are color-coded (N=4 independent experiments). Error bar = Mean +/− S.E.M.
F-G) Max IPs of untreated hiPSCs (0hrs) or treated with RPMI/B27(-Ins) plus 20ng/mL bFGF, 1ng/mL TGFβ or Vehicle for 24hrs and stained for DNA, cleaved Caspase-3 and F-actin. Scale bar = 100μm (F). Cleaved Caspase-3 staining was normalized to total cell area and reported in (G). Biological repeats are color-coded (N=30 random fields of view obtained from 3 independent biological repeats). Median: plain red line – Quartiles: black dotted lines. Dunn’s multiple comparison test was applied.
H) qRT-PCR data for pluripotency marker (NANOG), primitive streak (EOMES), mesoderm (TBXT) and cardiac mesoderm (TBX6 and MESP1) from untreated hiPSCs (0hrs) or treated with RPMI +/− CHIR for 48hrs. Biological repeats are color-coded (n=3 independent experiments). Error bar = Mean +/− S.E.M. Tukey’s multiple comparison test was applied. Values from “+ CHIR” condition are from Extended Data 1 B–C.
I-L) Max IPs of WT hiPSCs treated with RPMI/B27(-Ins.) +/− CHIR for 48hrs and stained for DNA, EOMES (I) and T/Bra (K). Scale bar = 5 μm. Quantifications of EOMES and T/Bra expression are in (J) and (L) respectively. Biological repeats are color-coded (N=20 random fields of view obtained from 3 independent biological repeats). Median: plain red line – Quartiles: black dotted lines. Mann-Whitney test was applied (two-tailed).
Source numerical data and unprocessed blots are available in source data.
