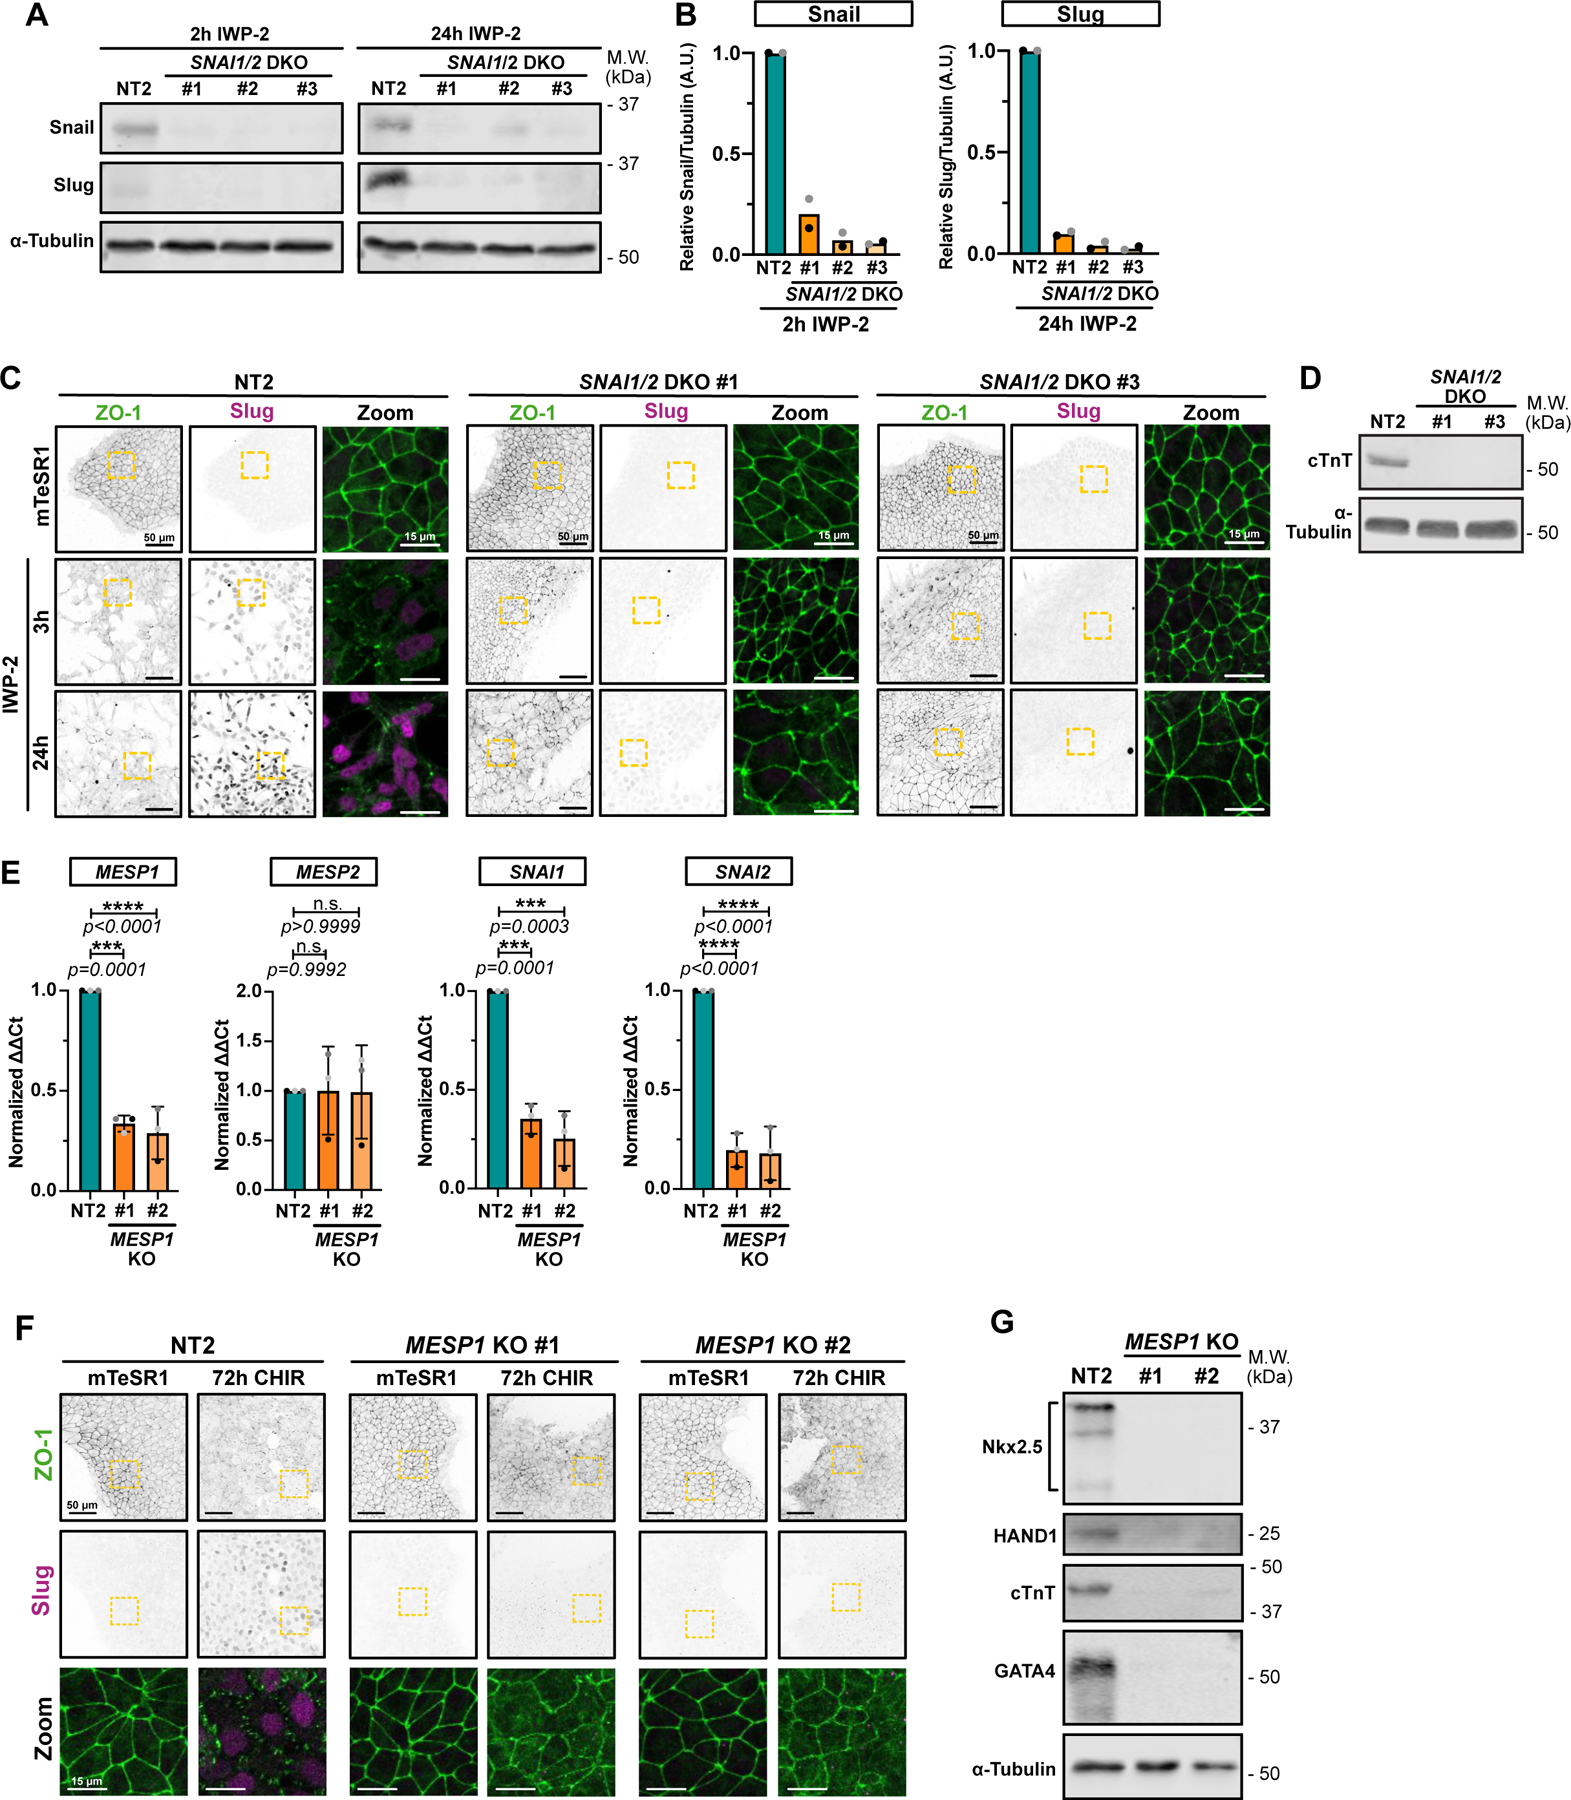
Figure 3.

A-B) Representative immunoblot of SNAI1/SNAI2 double knockout (DKO) hiPSC cell lines (non-clonal). Lysates from Non-targeting (NT2) or DKO cell lines were collected 2hrs after IWP-2 treatment (to confirm SNAI1 knockout – Left panel) or 24hrs after IWP-2 treatment (to confirm SNAI2 knockout – Right panel). Expression levels of Snail and Slug from 2 biological replicates were quantified by densitometry and normalized to NT2 (B).
C) Representative immunofluorescence images of control NT2 and two independent SNAI1/SNAI2 DKO lines, fixed at different time points and stained for ZO-1 (green) and Slug (Magenta). Max IPs are shown. Scale bar = 50μm. Magnified area (yellow dotted square) is shown as a merge. Scale bar = 15μm. (n=3 independent experiments).
D) Immunoblot of control NT2 and SNAI1/SNAI2 DKO #1 and #3 hiPSC-derived cardiomyocytes, at 12 days post induction. Expression of cardiac Troponin T (cTnT) and α-Tubulin as loading control were analyzed. Molecular weights (M.W.) are indicated in kDa.
E) Relative gene expression of MESP1, MESP2, SNAI1 and SNAI2 obtained from control (NT2) or two independent MESP1 knockout hiPSCs line (#1 and #2) were analyzed by qRT-PCR. ΔΔCt values were normalized to NT2. Independent biological repeats are color-coded (n=3 independent experiments). Error bar = Mean +/− S.D. Dunnett’s multiple comparison test was applied.
F) Representative Max IPs of control NT2 and two independent MESP1 KO (#1 and #2) non-clonal cell lines stained for ZO-1 (green) and Slug (Magenta) before (mTeSR1) and after 72hrs CHIR treatment. Scale bar = 50μm. Magnified area (yellow dotted square) is shown as a merge. Scale bar = 15μm.
G) Immunoblot of control NT2 and MESP1 KO #1 and #2 hiPSC-derived cardiomyocytes, at 12 days post induction. Expression of cardiac lineage markers (cardiac Troponin T, Nkx-2.5, GATA-4, HAND1) and α-Tubulin as loading control were analyzed.
Source numerical data and unprocessed blots are available in source data.
