
Figure 4.
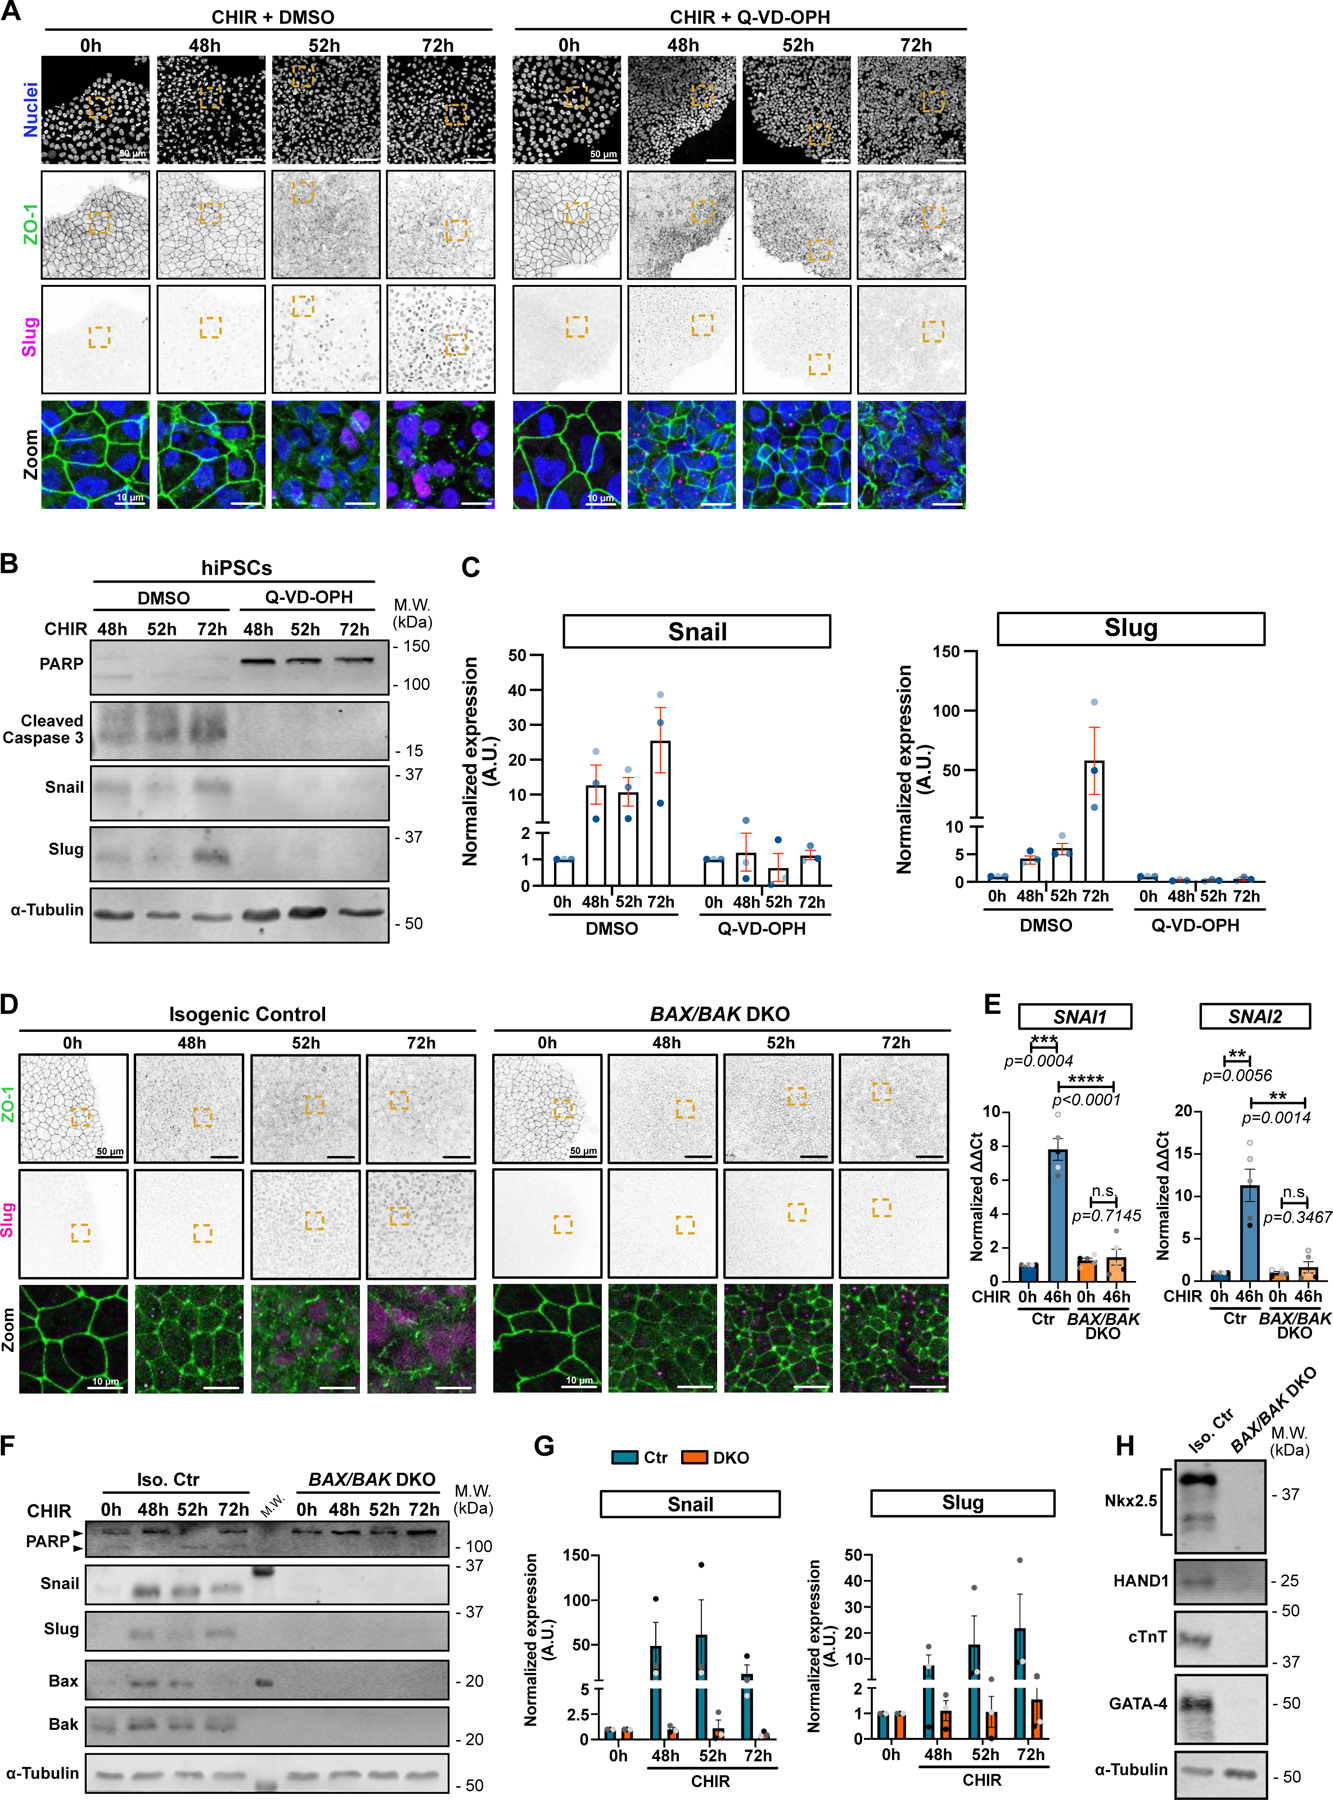
A) Representative Max IPs of hiPSCs co-treated with CHIR + DMSO (left) or CHIR + 10 μM Q-VD-OPH (right) stained for ZO-1 (green), Slug (magenta) and nuclei (blue) at indicated time. Scale bar = 50 μm. Magnified area (yellow dotted square) is shown as a merge. Scale bar = 10μm.
B-C) Immunoblot analysis of hiPSCs co-treated with CHIR + DMSO or 10 μM Q-VD-OPH and analyzed for cell death marker (PARP and cleaved Caspase-3), EMT markers (Snail and Slug) α-Tubulin as loading control. Molecular weights (M.W.) are indicated in kDa (B). Normalized expression of Snail and Slug was quantified by densitometry across 3 independent biological replicates (color-coded). Mean +/− S.E.M. (C).
D) Max IPs images of isogenic control and BAX/BAK double knockout (DKO) hiPSCs, treated with CHIR and stained for ZO-1 (green) and Slug (magenta) at the indicated time. Scale bar = 50 μm. Magnified area (yellow square) is shown as a merge. Scale bar = 15μm.
E) Relative gene expression of SNAI1 and SNAI2 obtained from isogenic control (Ctr) or BAX/BAK DKO hiPSCs, +/−CHIR for 46hrs and analyzed by qRT-PCR. ΔΔCt values were normalized to un-induced control cells. Biological repeats are color-coded (N=5 independent experiments). Error bar = Mean +/− S.E.M. Two-tailed paired t-test was applied to compare 0hrs vs 46hrs and unpaired t-test was applied to compare Ctr vs DKO.
F-G) Immunoblot analysis of isogenic control (Iso. Ctr) and BAX/BAK DKO hiPSCs, treated with CHIR and collected at indicated time. Molecular weights (M.W.) are indicated in kDa (F). Normalized expression of Snail and Slug was quantified by densitometry across 3 biological replicates (color-coded). Mean +/− S.E.M. (G).
H) Immunoblot of isogenic control (Iso. Ctr) and BAX/BAK DKO hiPSC-derived cardiomyocytes, at 12 days post induction. Expression of cardiac lineage markers (cardiac Troponin T, Nkx-2.5, GATA-4, HAND1) and α-Tubulin as loading control were analyzed.
Source numerical data and unprocessed blots are available in source data.