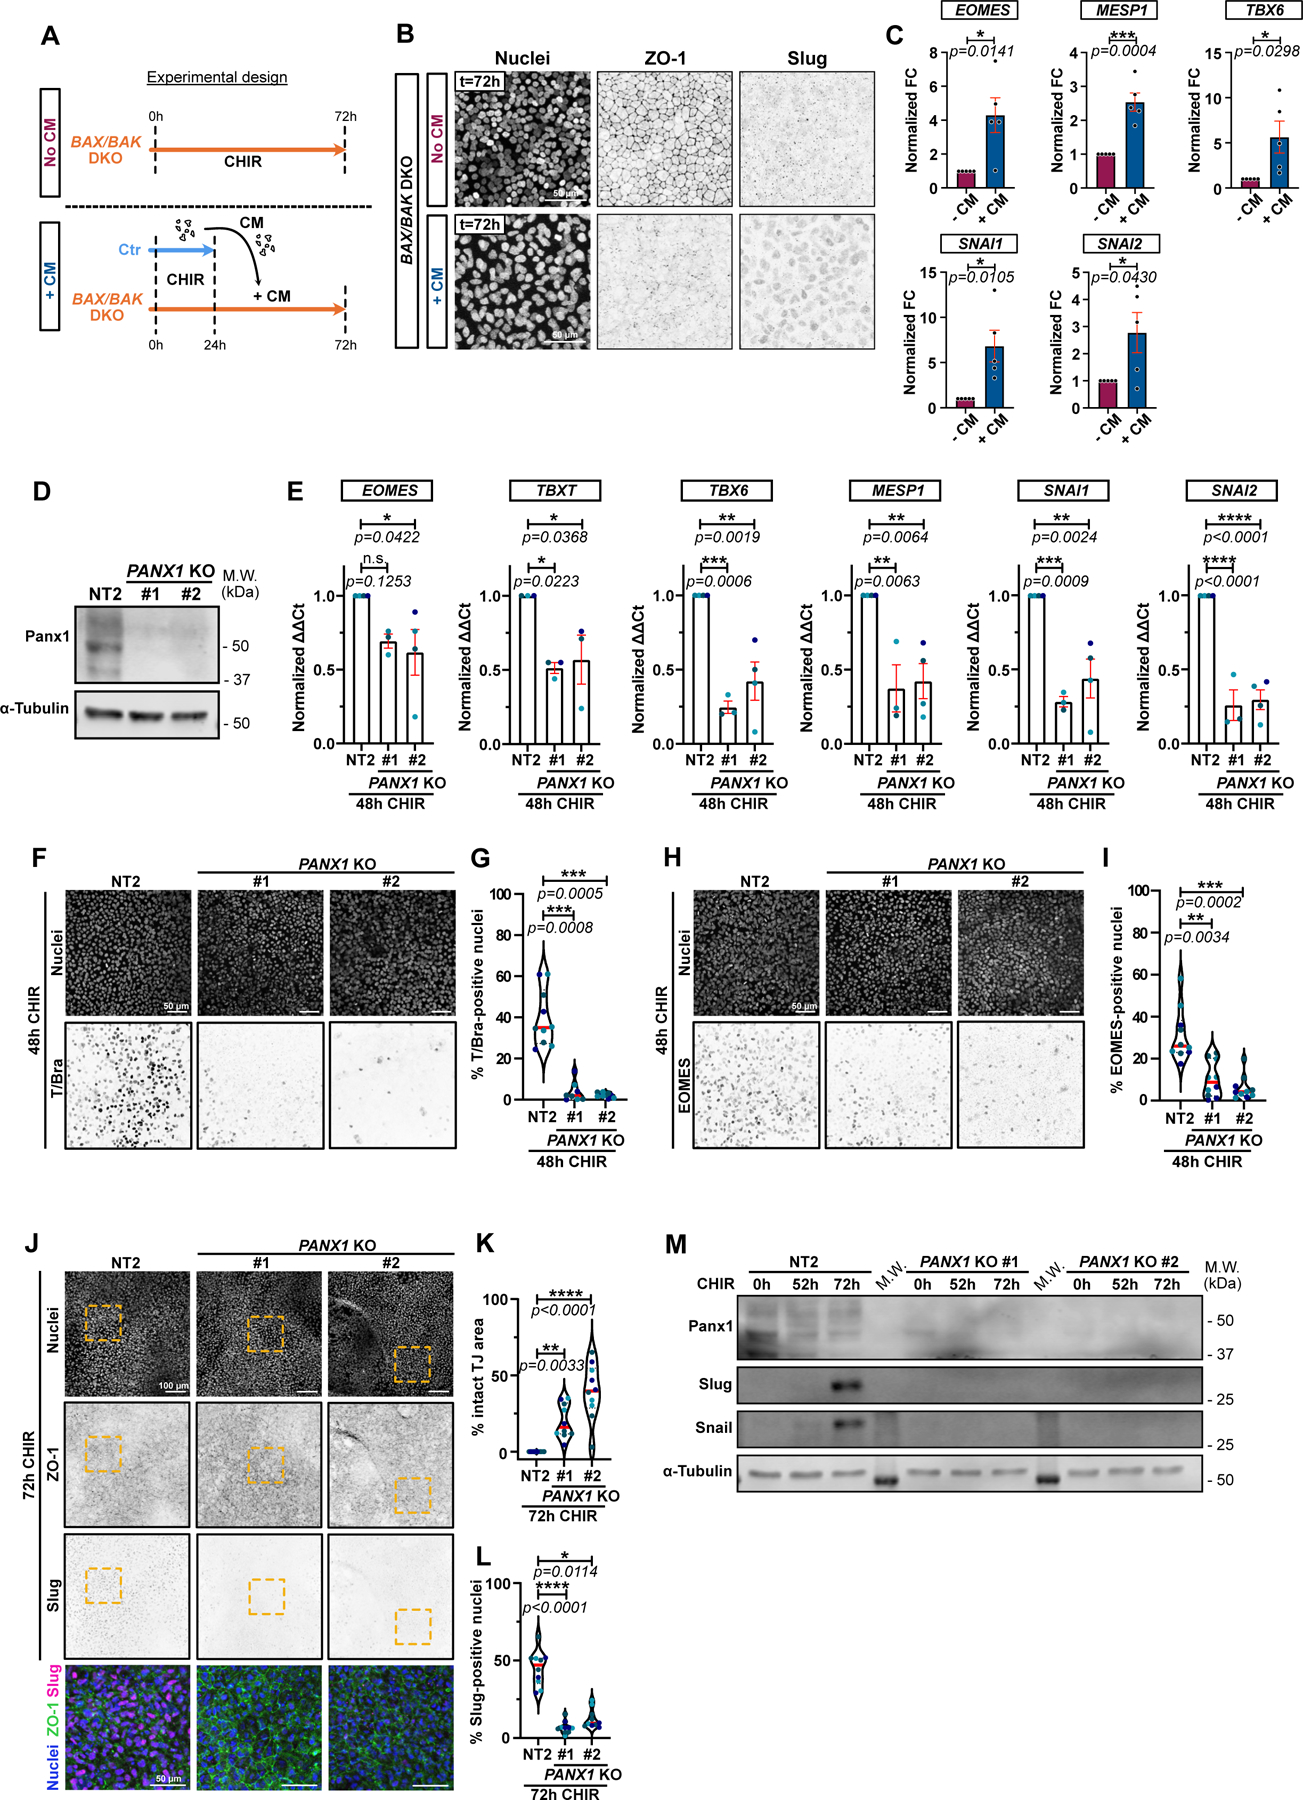
Figure 6.

A) Timeline of conditioned media (CM) experiment. Isogenic control (Ctr) and BAX/BAK DKO cells were treated with CHIR for 24hrs. Ctr cell supernatant was transferred onto BAX/BAK DKO and incubated for another 48hrs. As a control, BAX/BAK DKO were kept in CHIR for 48hrs (No CM).
B) Max IPs of BAX/BAK DKO cells treated in (A), stained for ZO-1, Slug, and nuclei. Scale bar = 50μm.
C) Relative expression of EOMES, MESP1, TBX6, SNAI1 and SNAI2 in BAX/BAK DKO hiPSCs treated as in A and analyzed by qRT-PCR across 5 biological repeats. Fold-change in ΔΔCt values normalized to -CM condition. Error bar = Mean +/− S.E.M. Two-tailed paired t test was applied.
D) Immunoblot for Pannexin-1 on control NT2 and 2 independent PANX1 KO cell lines (#1 and #2).
E) Relative expression of EOMES, TBXT, TBX6, MESP1, SNAI1 and SNAI2 from control NT2 or PANX1 KO hiPSCs, analyzed after 48hrs +CHIR. ΔΔCt values normalized to NT2. Biological repeats are color-coded (N=3 independent experiments for KO #1 and n=4 independent experiment for NT2 and KO #2, except for TBXT where all data set were obtained from 3 independent experiments). Error bar = Mean +/− S.E.M. Dunnett’s multiple comparisons test was applied.
F-I) Max IPs of control (NT2) and PANX1 KO hiPSCs stained for T/Bra (F) or EOMES (H) and nuclei, after +CHIR. Scale bar = 50μm. (F, H). Percentage T/Bra-positive (G) and EOMES-positive (I) nuclei (Median: plain red line – Quartiles: black dotted lines). Biological repeats are color-coded (G: N=8 random fields of view for KO #1 and n=10 random fields of view for NT2 and KO #2, obtained from 3 independent experiments. I: N=10 random fields of view obtained from 3 independent experiments). Dunn’s multiple comparison test was applied (G, I).
J-L) Max IPs of control (NT2) and PANX1 KO hiPSCs stained for ZO-1 (green), Slug (magenta) and nuclei (blue) after 72hrs +CHIR. Scale bar = 100μm. Magnified area (yellow square) shown as a merge. Scale bar = 50μm (J). Percentage of normalized area with intact tight junctions (K) and percentage Slug-positive (L) nuclei (Median: plain red line – Quartiles: black dotted lines). Biological repeats are color-coded (N=10 random fields of view obtained from 3 independent experiments). Tukey’s multiple comparison and Dunn’s multiple comparison test was applied respectively in (K) and (L).
M) Immunoblot of Snail and Slug from control NT2 and PANX1 KO cells following CHIR treatment.
Source numerical data and unprocessed blots are available in source data.
