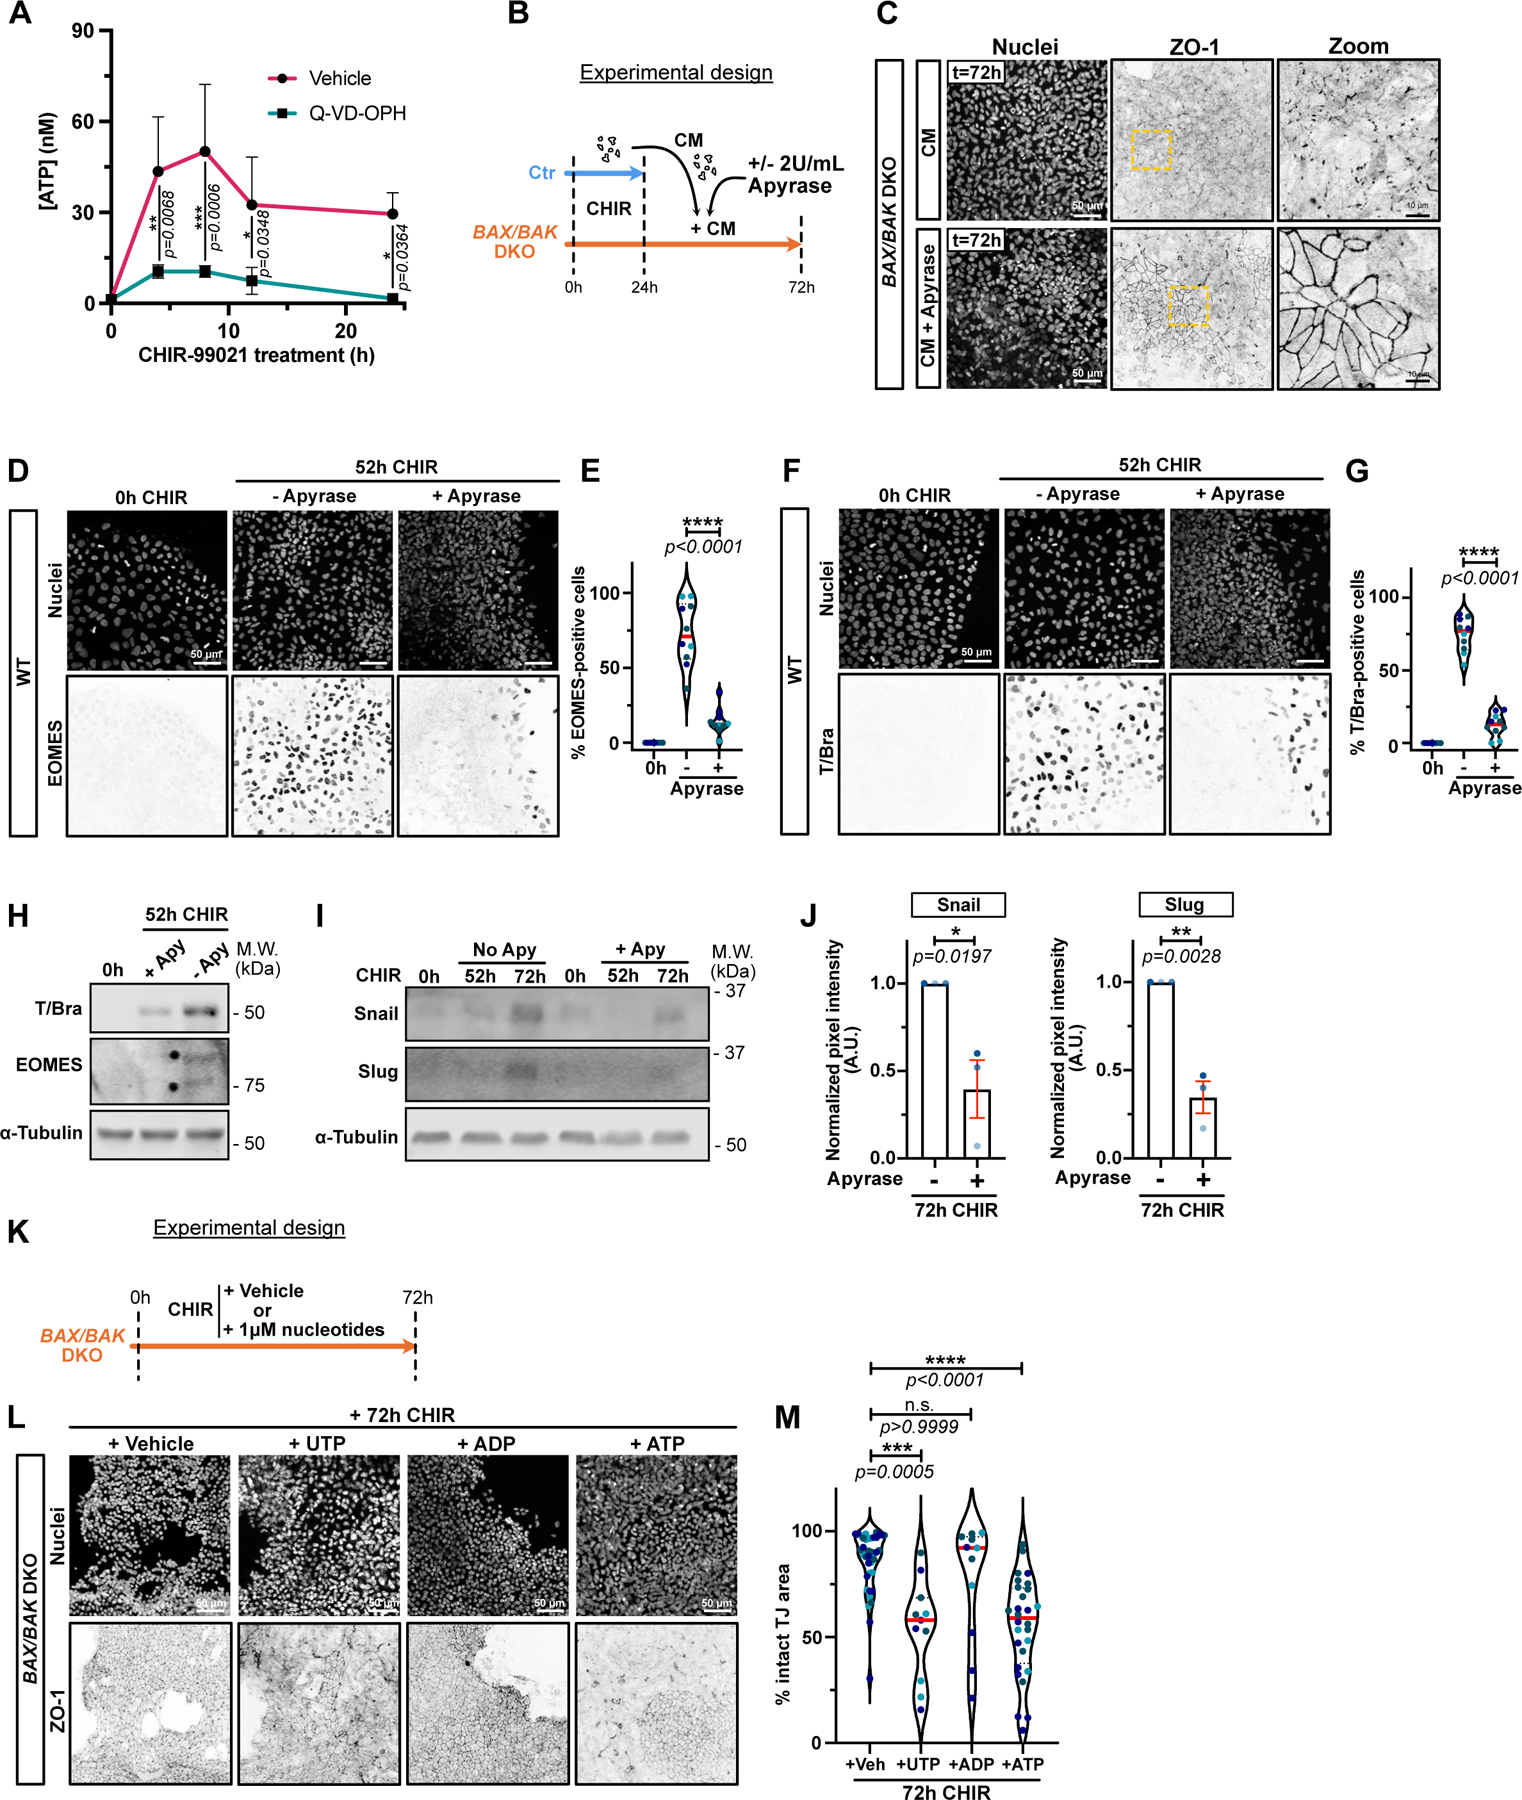
Figure 7.

A) Time course of ATP release from dying cells. Luciferase assay was performed on supernatants from hiPSCs treated with CHIR +/− 10 μM Q-VD-OPH at indicated times. Luminescence was converted to [ATP] using a standard curve. Three biological replicates were plotted as a line graph with mean +/− S.D. Two-way ANOVA with Sidak’s multiple comparisons test was applied. (N=3 independent experiments).
B) Timeline of apyrase-treated conditioned media (CM) experiment.
C) Max IPs of BAX/BAK DKO cells fixed after adding apyrase-treated CM as in (B). Cells were stained for ZO-1 and nuclei. Scale bar = 50μm. Magnified area (yellow dotted square) is shown for ZO-1 channel. Scale bar = 10μm.
D-G) Max IPs of WT iPSC before CHIR induction (0hrs) or following CHIR treatment +/− 2U/mL Apyrase. Cells stained for nuclei and EOMES (D) or T/Bra (F). Scale bar = 50μm. Percentage of EOMES (E) and T/Bra-positive (G) nuclei were quantified (Median: plain red line – Quartiles: black dotted lines). Biological repeats are color-coded (N=10 random fields of view obtained from 3 independent experiments). Two-tailed unpaired t-test test was applied (E, G).
H) Immunoblot for T/Bra and EOMES after CHIR induction +/− 2U/mL of Apyrase.
I-J) Immunoblot of WT hiPSCs treated with CHIR +/− 2U/mL Apyrase and probed for Snail, Slug and alpha-Tubulin (I). Normalized expression of Snail and Slug was quantified across 3 biological replicates (color-coded). Mean +/− S.E.M. Two-tailed unpaired t-test was applied (J).
K) Timeline of nucleotide sufficiency. BAX/BAK DKO hiPSCs were treated with CHIR plus vehicle (H2O) or 1μM of UTP, ATP or ADP and fixed after 72hrs.
L-M) Max IPs of BAX/BAK DKO hiPSCs treated as in (K) and stained for ZO-1 and nuclei. Scale bar = 50μm (L). Normalized area with intact tight junctions was measured. Biological repeats are color-coded (Veh: N=38 random fields of view, UTP and ADP: N=11 random fields of view, ATP: N=28 random fields of view, all obtained from 3 independent experiments). Dunn’s multiple comparison test was applied.
Source numerical data and unprocessed blots are available in source data.
