
Figure 8.
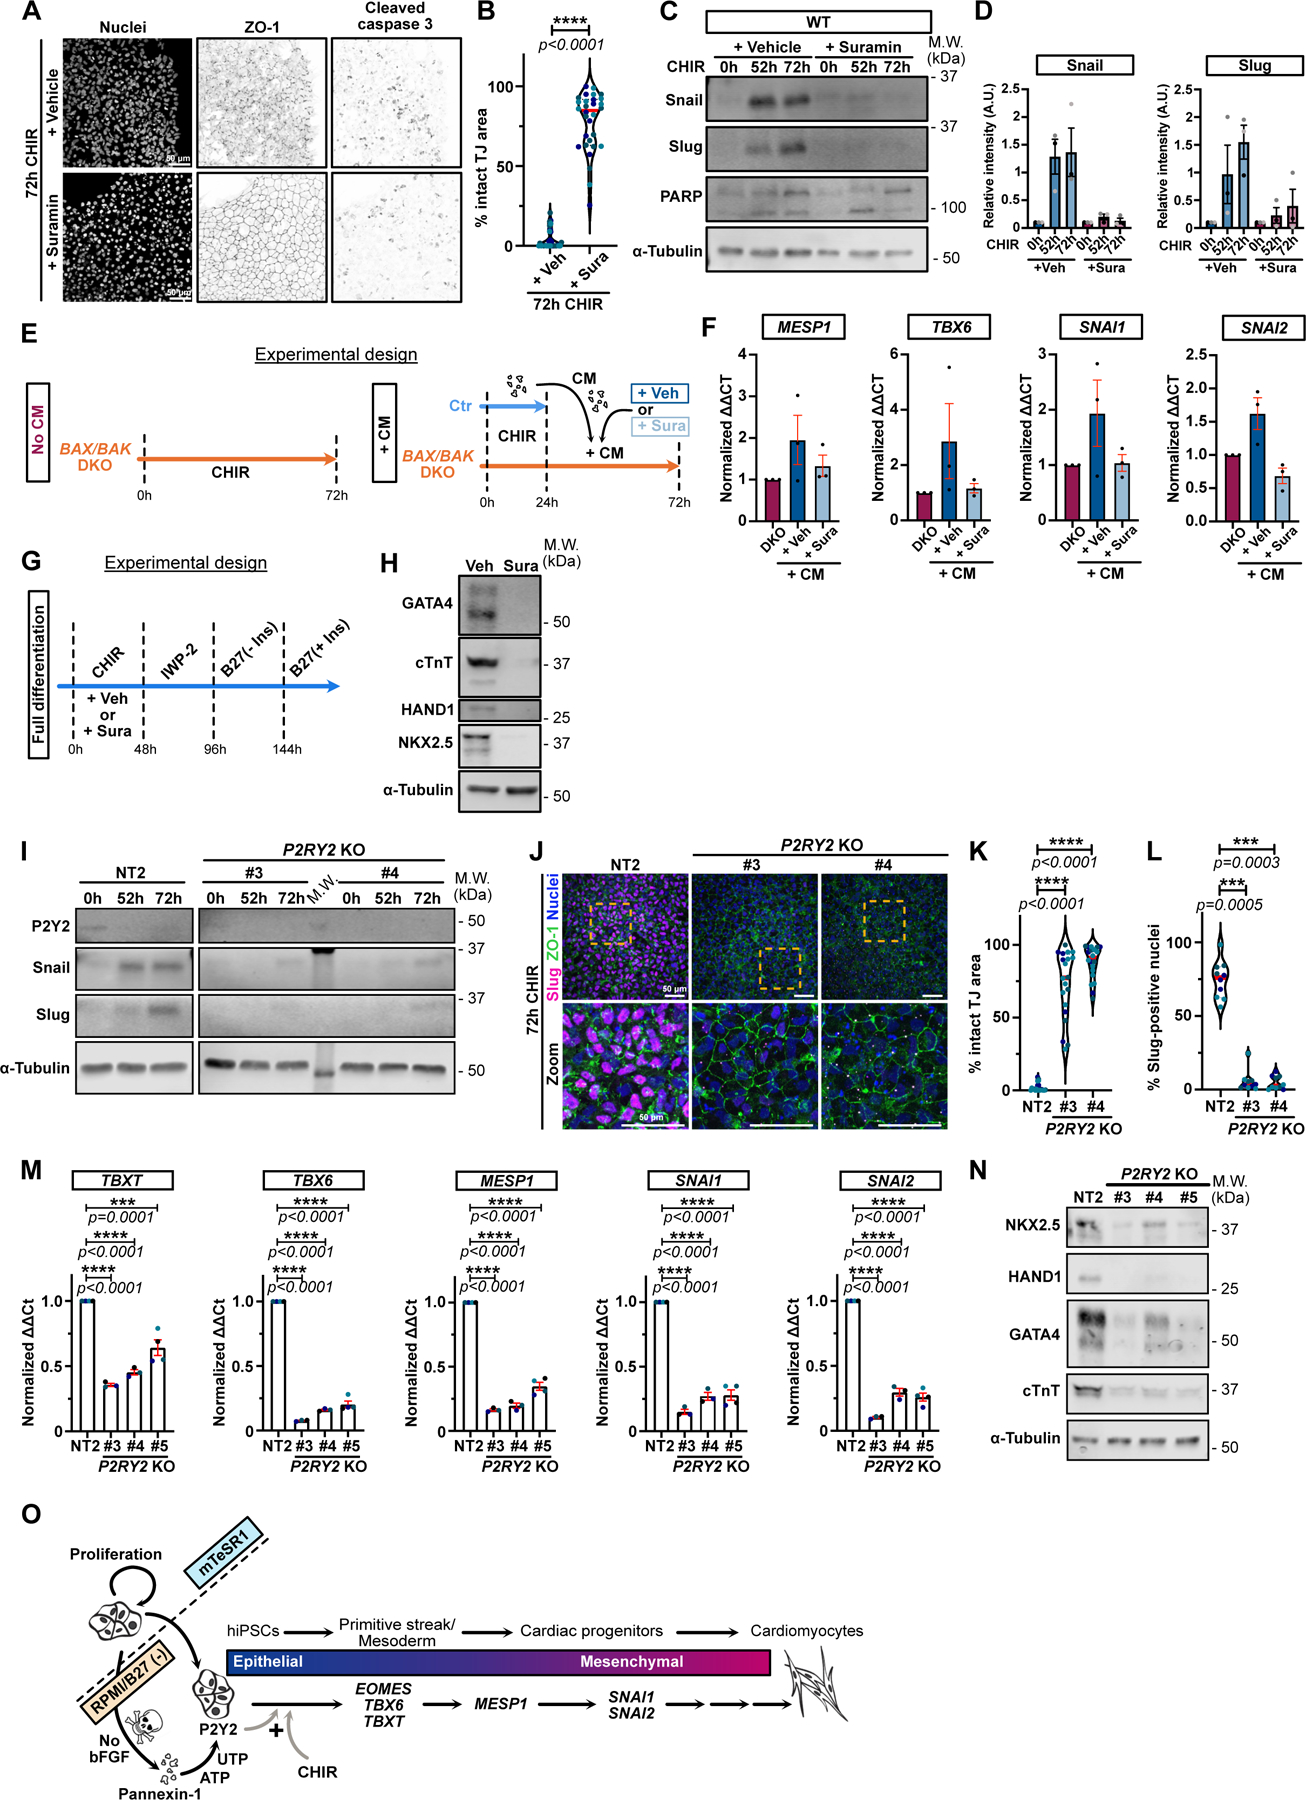
A-B) Max IPs of WT hiPSCs treated with CHIR +/− 100 μM Suramin and stained for ZO-1, cleaved-caspase 3 and nuclei. Scale bar = 50μm (A). Area with intact tight junctions is displayed. (Median: plain red line – Quartiles: black dotted lines). Biological repeats color-coded (N=30 random fields of view obtained from 3 independent experiments). Two-tailed Mann-Whitney t-test was applied (B).
C-D) Immunoblot of WT hiPSCs treated with CHIR +/− 100 μM Suramin and probed for Snail, Slug, PARP and α-Tubulin (C). Normalized expression of Snail and Slug was quantified across 3 independent biological replicates (color-coded). Error bar = Mean +/− S.E.M (D).
E) Timeline of conditioned medium (CM) experiment with Suramin.
F) Relative expression of MESP1, TBX6, SNAI1 and SNAI2 from BAX/BAK DKOs treated as in (E), across 3 independent biological replicates. Mean +/− S.E.M.
G) Complete cardiomyocyte differentiation protocol timeline. 100 μM Suramin or Vehicle (DMSO) was added for 48hrs during the CHIR treatment.
H) hiPSC were treated as in (G) and analyzed for cardiac markers (GATA4, cTnT, HAND1, Nkx2.5) and α-Tubulin 12 days post differentiation initiation.
I) Immunoblot of control NT2 and 2 P2Y2 KO iPSC lines treated with CHIR as indicated and probed for P2Y2, Snail, Slug, and α-Tubulin.
J-L) Max IPs of control (NT2) and P2Y2 KO hiPSCs stained for ZO-1 (green), Slug (magenta) and nuclei (blue) after 72hrs +CHIR. Scale bar = 50μm. Magnified area (yellow square) is shown. Scale bar = 50 μm (J). Area with intact tight junctions (K) or % Slug-positive (L) nuclei are presented (Median: plain red line – Quartiles: black dotted lines). Biological repeats color-coded (K: N=20 random fields of view obtained from 3 independent experiments, L: N=10 random fields of view obtained from 3 independent experiments). Dunn’s multiple comparison test was applied.
M) Relative gene expression from control NT2 or P2Y2 KO hiPSCs, analyzed after 48hrs +CHIR. ΔΔCt values normalized to NT2. Biological repeats are color-coded (N=3 independent experiments for KO #3 and KO #4 and N=4 independent experiments for NT2 and KO #5). Error bar = Mean +/− S.E.M. Tukey’s multiple comparisons test was applied.
N) NT2 and P2Y2 KO hiPSCs were differentiated and immunoblotted for cardiac markers.
O) Proposed working model for cardiogenesis by pluripotent stem cells. Loss of bFGF triggers apoptosis and nucleotide release through Pannexin1 channels. Nucleotides bind P2Y2 receptors on surviving cells, licensing a response to WNT signaling and commitment to mesoderm specification. The plus sign (+) reflects that neither signal alone is sufficient for specification.
Source numerical data and unprocessed blots are available in source data.