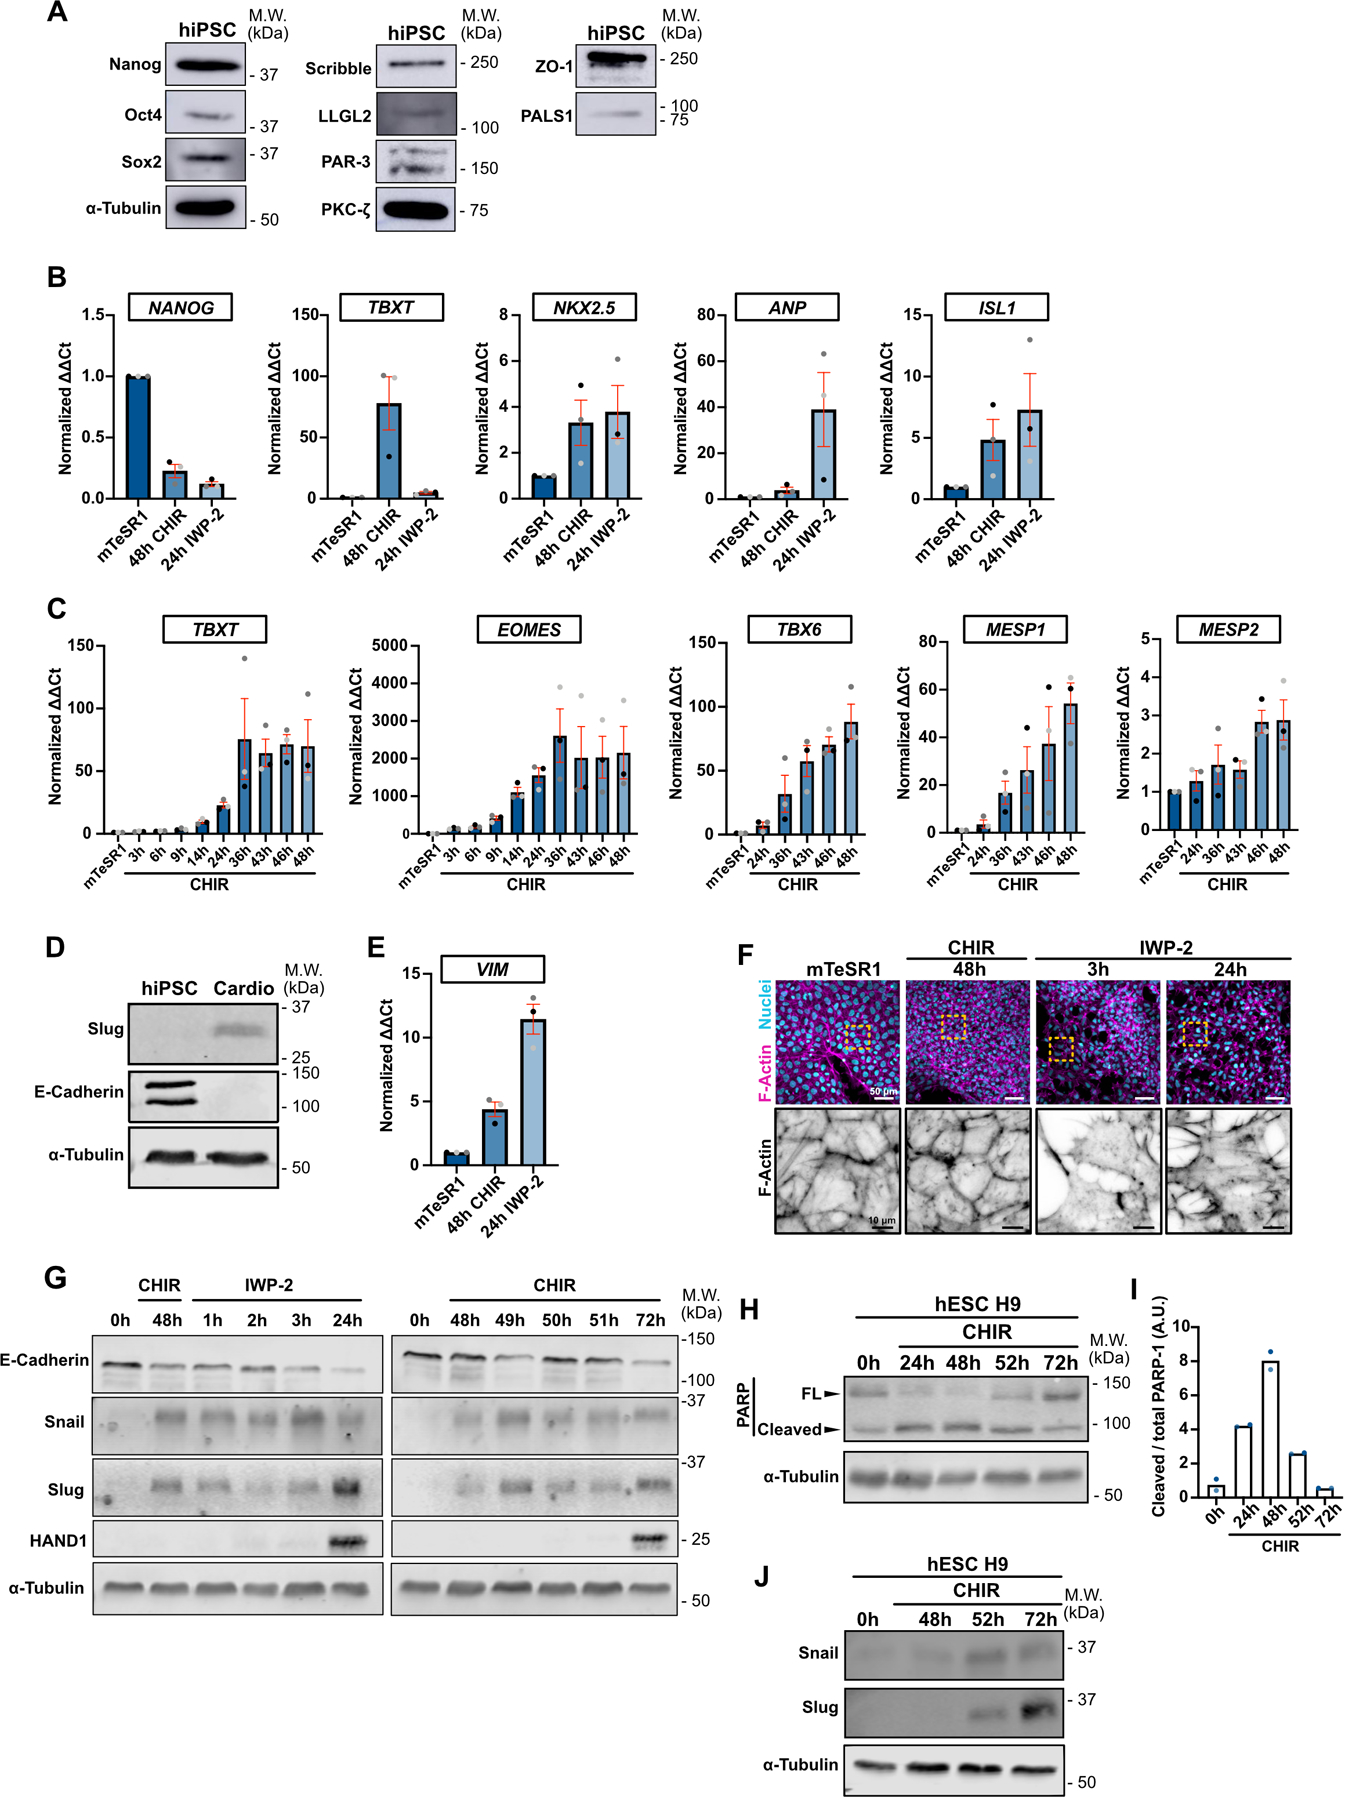
Extended Data Fig. 1. Pluripotent stem cells undergo EMT during conversion to cardiac mesoderm.

A) Representative immunoblot of WT hiPSC for pluripotency markers (Nanog, Oct4, Sox2), tight junctions marker (ZO-1), Crumb complex (PALS1), PAR complex (PAR-3, PKC-ζ), Scribble complex (LLGL2, Scribble) and α-Tubulin. Molecular weights (M.W.) are indicated in kDa.
B) Relative gene expression of NANOG, TBXT, NKX2.5, ANP, ISL1 during differentiation. ΔΔCt values were normalized to the mTeSR1 condition (prior to cell differentiation). Independent biological repeats are color-coded (N=3 independent experiments). Mean +/− S.E.M.
C) Relative gene expression of TBXT, EOMES, TBX6, MESP1, MESP2 during CHIR induction. ΔΔCt values were normalized to the mTseSR1 condition (prior to cell differentiation). Independent biological repeats are color-coded (N=3 independent experiments). Mean +/− S.E.M.
D) Representative immunoblot of hiPSCs and hiPSC-derived cardiomyocytes obtained 12 days post differentiation (Top pathway described in Fig. 1B). Expression of EMT markers (Slug and E-Cadherin) were analyzed. Molecular weights (M.W.) are indicated in kDa. (N=2 independent experiments).
E) Relative gene expression of VIM was analyzed by qRT-PCR during cell conversion. ΔΔCt values were normalized to the mTseSR1 condition. Independent biological repeats are color-coded (N=3 independent experiments). Mean +/− S.E.M.
F) Representative Max IPs images of wildtype hiPSCs fixed at the indicated times along the differentiation protocol and stained for F-actin (Phalloidin) and nuclei (Hoechst). Scale bar = 50 μm. Magnified area of the F-actin channel (yellow dotted square) is shown. Scale bar = 10 μm.
G) Representative Immunoblot comparing expression of EMT markers (E-Cadherin, Snail, Slug) and cardiac marker (HAND1) between the two protocols shown in Fig. 1B.
H-I) Immunoblot of PARP cleavage in hESC H9 during CHIR treatment. Molecular weights (M.W.) are indicated in kDa (H). PARP cleavage was quantified by densitometry across 2 independent biological repeats (color-coded). Tukey’s multiple comparison was applied (I).
J) Snail and Slug expression was analyzed in hESC H9 following CHIR induction. Molecular weights (M.W.) are indicated in kDa.
Source numerical data and unprocessed blots are available in source data.
