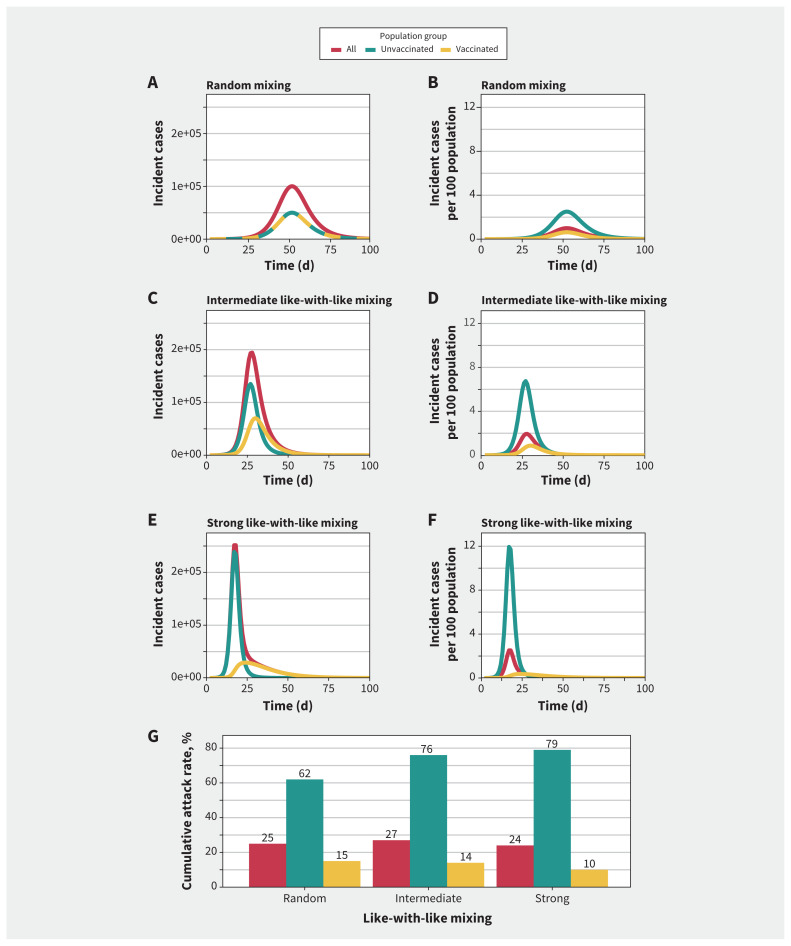
Figure 1:
Simulated epidemics for different levels of mixing between vaccinated and unvaccinated populations. (A, C, E) Incident cases and (B, D, F) population-adjusted incidence per 100 population in unvaccinated, vaccinated and overall modelled populations. The degree of like-with-like mixing (assortativity, η) varies from (A, B) random mixing (η = 0) to (C, D) intermediate like-with-like mixing (η = 0.5) to (E, F) near exclusive mixing with people of the same vaccination status (η = 0.9). As like-with-like mixing increases, epidemic size among the vaccinated subpopulation is smaller in absolute terms than among the unvaccinated subpopulation and also has a different contour. (G) Increasing like-with-like mixing increased cumulative attack rates among unvaccinated people and decreased cumulative attack rates among vaccinated people. The highest overall attack rates were seen with intermediate levels of like-with-like mixing.

