. 2020 May 20;10(33):19300–19308. doi: 10.1039/d0ra02156c

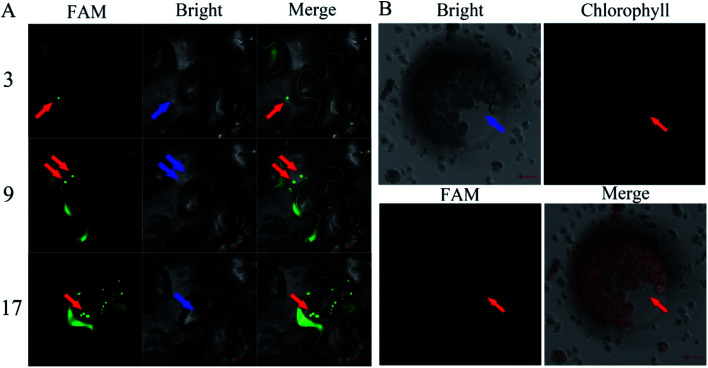
Fig. 4. Infiltration of the AuNPs-FAM-siRNANPR1 into plant cells. (A) Confocal image of AuNPs-FAM-siRNANPR1 fluorescence in Nicotiana benthamiana leaves. The cell edge is outlined with white and orange lines, and the number represents different scanning layers. The red arrow indicates that the green light spot is AuNPs-FAM-siRNANPR1, and the blue arrow indicates the same position of these fluorescence in the bright field. Images were taken under the excitation of 492 nm wavelengths (green is the fluorescence of FAM). Bars = 20 μm. (B) Confocal images of Arabidopsis protoplast expressing FAM. The protoplasts were collected after 1–2 hours of infiltration of AuNPs-FAM-siRNANPR1 into Arabidopsis leaves. Images were taken with excitation at 492 nm and 518 nm wavelengths. The green light spots represented by the red arrow is AuNPs-FAM-siRNANPR1. The blue arrow indicates the same position of these fluorescence in the bright field and chlorophyll field. Bars = 10 μm.

Fig. 4