. 2020 May 20;10(33):19382–19389. doi: 10.1039/d0ra03383a

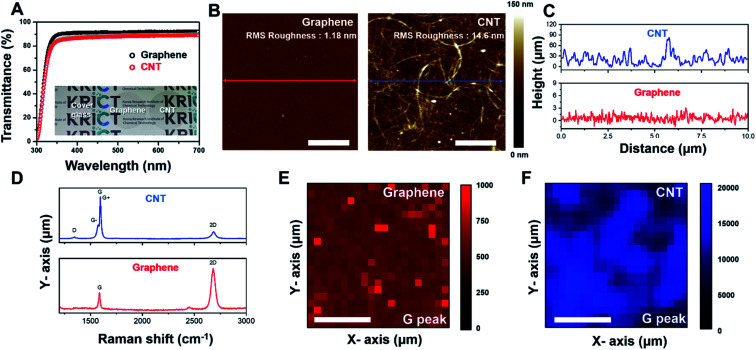
Fig. 1. Characterization of CNT network and graphene film. (A) Transmittance spectrum of CNT network and graphene film on cover glass. The inset image shows a digital image of cover glass, with CNT network and graphene film. (B) AFM images of graphene film (left) and CNT network film (right) on cover glass. (C) Topography information of the cross section of graphene film (bottom) and CNT network film (top). (D) Raman spectra of graphene film (bottom) and CNT network film (top). (E) Graphene film of each G peak intensity (F) CNT network film of each G peak intensity (scale bar is 20 μm). Each Raman mapping image was obtained from a size of 50 μm × 50 μm.

Fig. 1