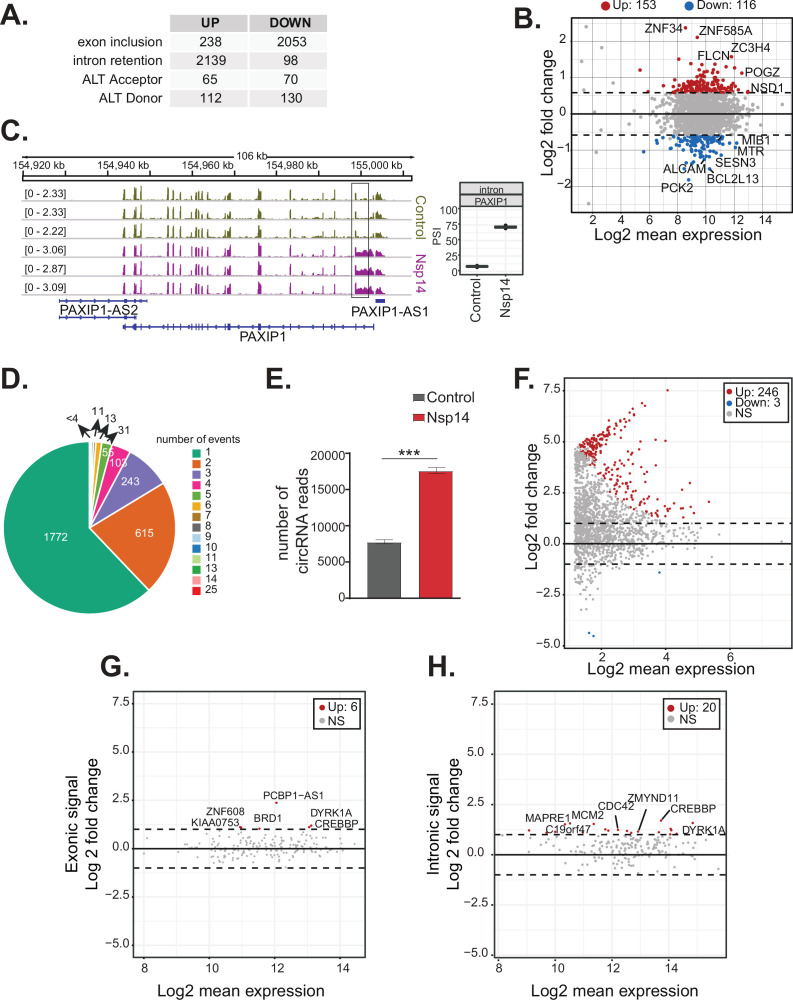
Figure 3. Nsp14 expression alters the splicing of a subgroup of genes and increases circRNAs expression.
(A) Table summarizing splicing analysis comparison between Nsp14 expression and control. Thresholds used: ∆PSI (percentage of inclusion) > 15% and a non-overlapping distribution with minimum of 5% difference (N = 3). (B) Fold change vs. expression in logarithmic scale for the genes with upregulated intron retention. In red genes with increased expression and in blue the ones with downregulated expression (fold change = 2, adjusted p-value < 0.05, N = 3). (C) Representative IGV alignment tracks of on gene (PAXIP1) with intronic events differentially changing between conditions (control and Nsp14 expression). The box marks the changing event. On the right, quantification of PSI. (D) Pie chart representing number of alternative splicing events deregulated upon Nsp14 expression by gene; 1772 genes have only one alternative splicing event changing between conditions, 615 has two events and 243 genes have three alternative splicing events changing. (E) Number of circRNAs reads detected in the total RNA sequencing (RNA-seq) experiment. Data represented as mean ± SEM, N = 3, t-test, ***p-value < 0.0005. (F) Fold change vs. expression in logarithmic scale for circRNAs in Nsp14 expression vs. control. In red upregulated genes and in blue downregulated genes (fold change = 2, adjusted p-value < 0.05, N = 3). (G) Plot of fold change vs. expression in logarithmic scale for exonic signal detected in the total RNA-seq dataset in Nsp14 vs. control for genes with upregulated circRNA expression. In red genes with increased expression and (fold change = 2, adjusted p-value < 0.05, N = 3). (H) Plot of fold change vs. expression in logarithmic scale for intronic signal detected in the total RNA-seq dataset in Nsp14 vs. control for genes with upregulated circRNA expression. In red genes with increased expression and in gray non-significant ones (fold change = 2, adjusted p-value < 0.05, N = 3).


