. 2022 Mar 16;11:e71945. doi: 10.7554/eLife.71945

Figure 5. NFkB pathway is activated soon after Nsp14 transfection.

(A) Principal component analysis of the 3’ RNA sequencing (RNA-seq) of the time course experiment. Arrows indicate how samples separate according to the time point or condition (Nsp14 expression or control). (B) Heatmap showing increasing number of up- and downregulated genes at different time points after Nsp14 expression. (C) Heatmap representing the Gene Ontology analysis result at the indicated time points. (D) Expression of CXCL8 across the indicated time points in the 3’ RNA-seq data. Data represented as mean ± SEM, N = 3, t-test, **p-value < 0.005, *p-value < 0.05. (E) Luciferase assay showing that CXCL8 is transcriptionally activated after Nsp14 expression. Firefly expression is controlled by CXCL8 promoter, whereas Renilla is under the control of a constitutive promoter. Data represented as mean ± SEM, N = 6, t-test, **p-value < 0.005. (F) Table showing the enrichment for specific transcription factor (TF) binding sites in the promoter (100 bp upstream the transcription starting site of the upregulated genes) (lfc >0.8, adjusted p-value < 0.05) at 8 hr after Nsp14 transfection.

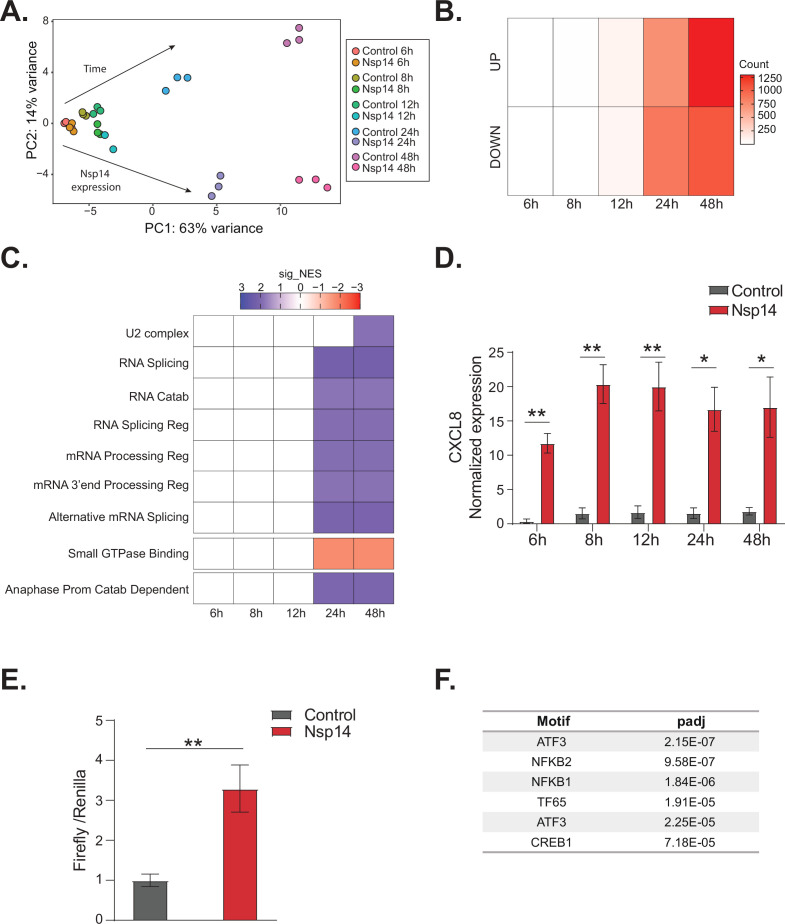
Figure 5.

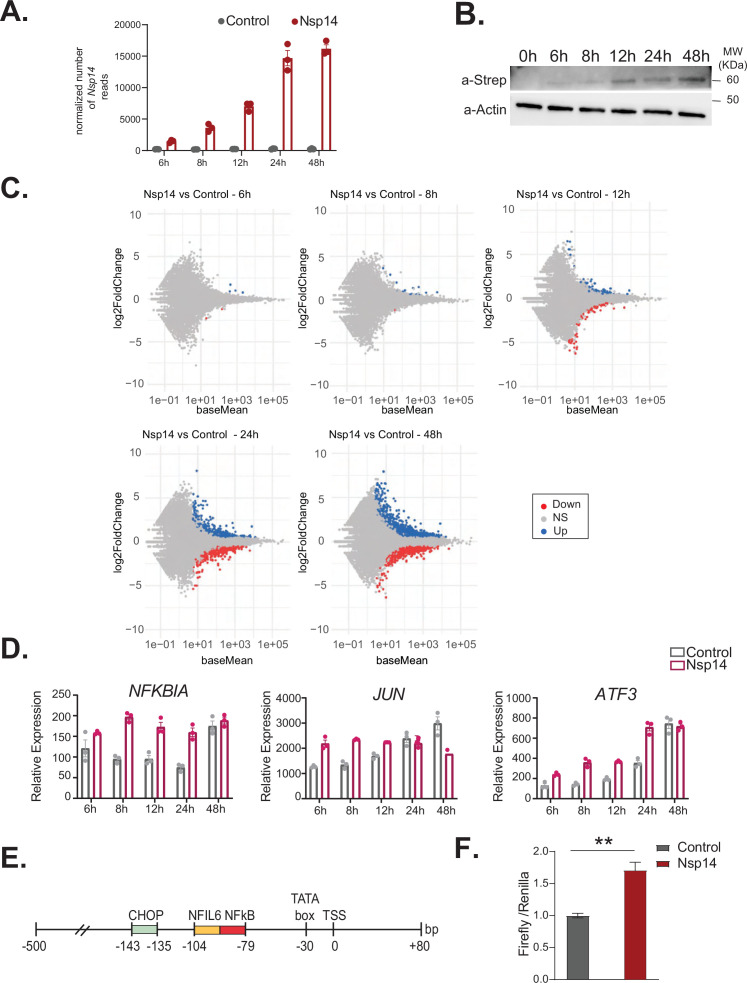
Figure 5—figure supplement 1. NFkB pathway is one of the first pathways activated after Nsp14 transfection.

Figure 5—figure supplement 1.

(A) Plot showing the normalized number of Nsp14 reads from the 3’ RNA sequencing (RNA-seq) experiment, at the indicated time points, in cells transfect with a control plasmid (control), or the Nsp14 plasmid (Nsp14). (B) Western blot showing increasing amount of Nsp14 at the indicated time points in cells transfected with the Nsp14 plasmid. Nsp14 was detected through the Strep tag. Actin was used as loading control. See Figure 5—figure supplement 1—source data 1. (C) MA plots showing the expression fold change in-between the indicated conditions in 3’ RNA-seq. Significantly upregulated genes in blue, downregulated in red, and not significantly deregulated in gray. (D) Expression of selected genes across the indicated time points from the 3’ RNA-seq dataset. Data represented as mean ± SEM, N = 3. (E) Scheme of the CXCL8 promoter region used for the Firefly reporter. (F) Luciferase assay showing NFkB activation. Firefly expression is controlled by a minimal transcriptional activator recognized by NFkB, whereas Renilla is under the control of a ubiquitous promoter. Data represented as mean ± SEM, N = 6, t-test, **p-value < 0.005.
Figure 5—figure supplement 1—source data 1. Western blot data for Figure 5—figure supplement 1B.