. 2022 Mar 16;11:e71945. doi: 10.7554/eLife.71945

Figure 6. Pharmacological inhibition of inosine-monophosphate dehydrogenase 2 (IMPDH2) partially reverts the transcriptional changes induced by Nsp14.

(A) Expression of IMPDH2 mRNA is reduced upon Nsp14 expression. Data from the total RNA sequencing (RNA-seq) experiment. Data represented as mean ± SEM, N = 3, t-test, ***p-value < 0.0005. (B) In the upper panel, scheme reporting some of the tested metabolites deriving from inosine-5'-monophosphate (IMP) metabolism. IMPDH2 (highlighted in light blue) catalyzes the conversion of IMP to xanthine-5’-monophosphate (XMP), precursor of guanosine-5'-triphosphate (GTP). Significantly upregulated metabolites are highlighted in red. In the lower panel, GTP cellular concentration significantly increases in Nsp14-expressing cells. Data represented as mean ± SEM, N = 3, t-test, **p-value < 0.005. (C) Western blot showing that mycophenolic acid (MPA) treatment does not alter Nsp14 (detected through the Strep-tag) or IMPDH2 expression. Actin used as loading control. See Figure 6—source data 1. (D) Principal component analysis of the 3’ RNA-seq library of the indicated samples. (E) Table reporting the number of upregulated and downregulated genes in the indicated comparisons. (F) Plot showing the distribution of fold changes of all genes detected in the 3’ RNA-seq in the indicated conditions. (G) RT-qPCR showing the retention of the first intron for PAXIP1, SETD1A, and ZNF507 in the indicated conditions. Data represented as mean ± SEM, N = 3.

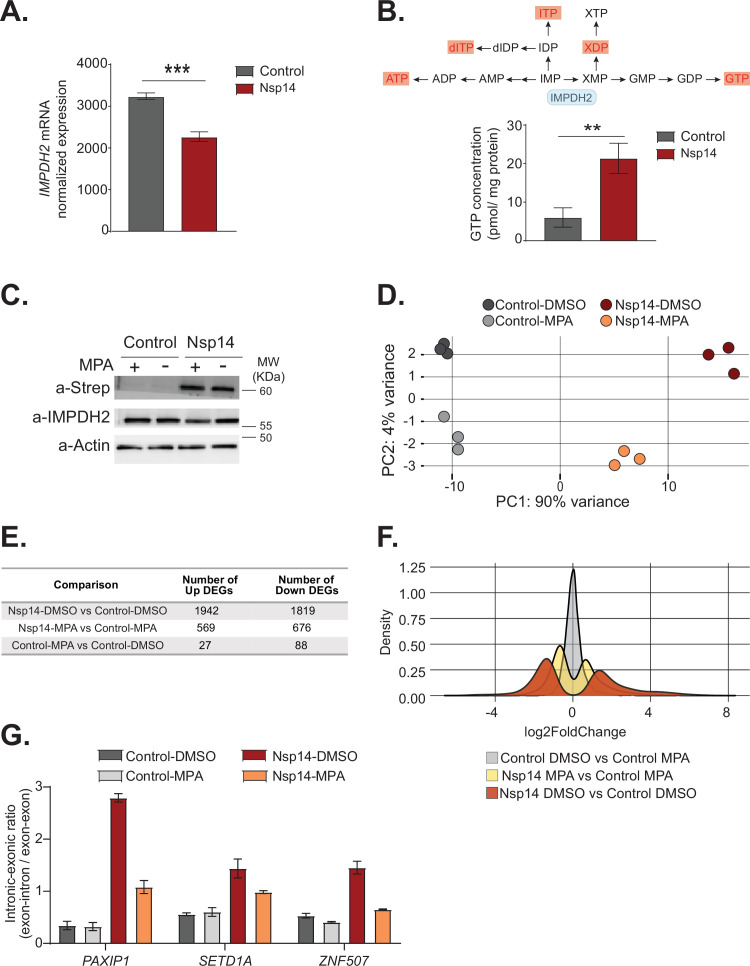
Figure 6—source data 1. Western blot data for Figure 6C.

Figure 6.

Figure 6—figure supplement 1. Nsp14 localizes in the cytoplasm and IMPDH2 mediates the effects induced by Nsp14.

Figure 6—figure supplement 1.

(A) Western blots of the subcellular fractionation and chromatin precipitation at the indicated time points post transfection (12, 24, and 48 hr) in cells transfected with an empty plasmid (control), or Nsp14 (Nsp14). Nsp14 was detected through the Strep tag. GAPDH is used as cytoplasmatic marker, and H3K27me3 as a chromatin-bound marker. See Figure 6—figure supplement 1—source data 1. (B) MA plots relative to the 3’ RNA sequencing (RNA-seq) experiment of cells transfected with a control plasmid (control) or Nsp14 (Nsp14) and treated with the vehicle (DMSO) or mycophenolic acid (MPA) (MPA). Significantly upregulated genes in blue, downregulated in red, and not significantly deregulated in gray.
Figure 6—figure supplement 1—source data 1. Western blot data for Figure 6—figure supplement 1A.
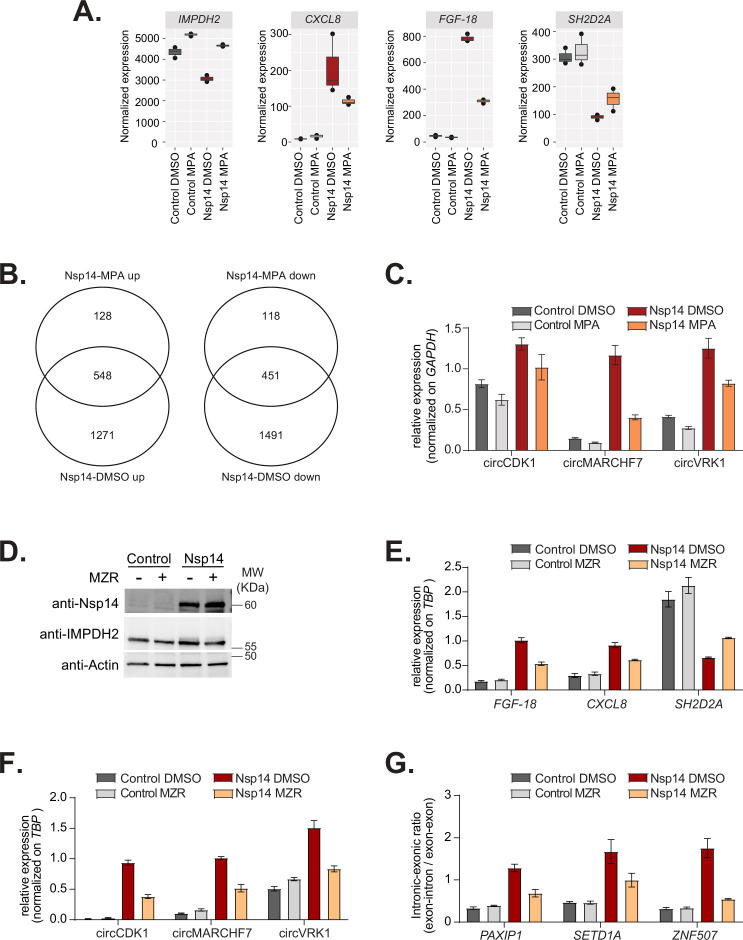
Figure 6—figure supplement 2. Inhibition of IMPDH2 partially reverts the changes induced by Nsp14.

Figure 6—figure supplement 2.

(A) Expression of inosine-monophosphate dehydrogenase 2 (IMPDH2), FGF-18, SH2D2A, and CXCL8 in the 3’ RNA sequencing (RNA-seq) dataset in the indicated conditions. (B) Venn diagram showing the common genes upregulated (left) or downregulated (right) in samples expressing Nsp14 and treated with or without mycophenolic acid (MPA). (C) RT-qPCR showing the expression of circCDK1, circMARCHF7, and circVKR1 in the indicated conditions. Data represented as mean ± SEM, N = 3. (D) Western blot showing that mizoribine (MZR) treatment does not alter Nsp14 or IMPDH2 expression. Actin used as loading control. See Figure 6—figure supplement 2—source data 1. (E) RT-qPCR showing the expression of FGF-18, CXCL8, and SH2D2A, in the indicated conditions. Data represented as mean ± SEM, N = 3. (F) RT-qPCR showing the expression of circCDK1, circMARCHF7, and circVKR1 in the indicated conditions. Data represented as mean ± SEM, N = 3. (G) RT-qPCR showing the retention of the first intron for PAXIP1, SETD1A, and ZNF507 in the indicated conditions. Data represented as mean ± SEM, N = 3.
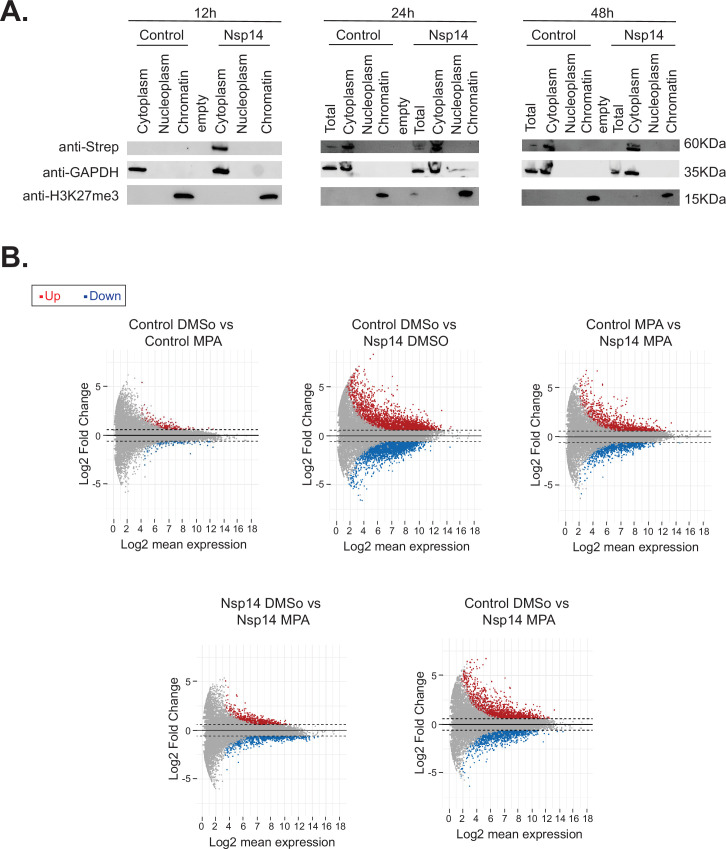
Figure 6—figure supplement 2—source data 1. Western blot data for Figure 6—figure supplement 2D.