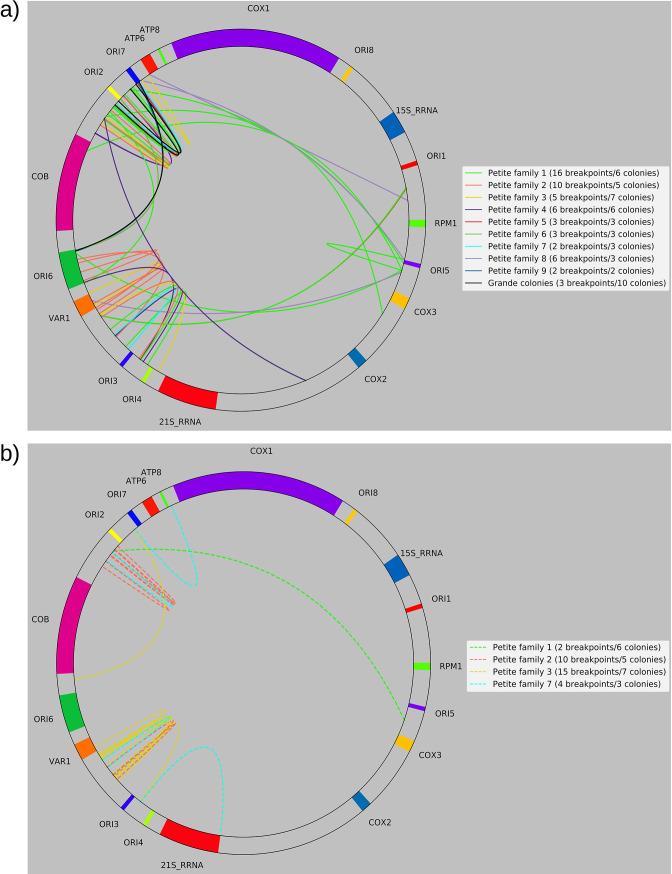
Appendix 1—figure 2. Separated non-inverted/inverted circular breakpoint plots.
Here, we provide an alternate representation of the breakpoint summary in Figure 2c that separates non-inverted and inverted breakpoints and represents breakpoints as arcs to improve readability. The mitochondrial reference has also been circularized. (a) Non-inverted breakpoint locations. Here solid-colored arcs directly show the regions of mtDNA that interact in creating breakpoints. (b) Inverted breakpoint locations represented as dashed lines.

