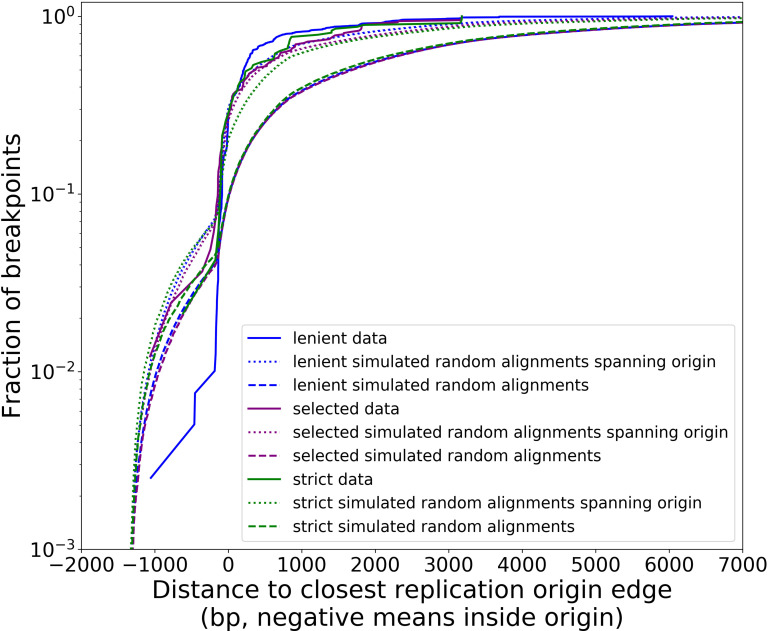
Appendix 1—figure 3. Distribution of minimum distances between alignment edges and origin edges is robust to different structural detection pipeline parameter regimes.
Real data (solid lines in this plot) follow all filtering steps in our structural pipeline, including inverted duplication artifact filtering, and majority voting (except ‘lenient’ parameter set). The different data curves are a result of the aforementioned filtering steps in the pipeline, but with different parameters (Appendix 2—table 2). Small, dotted lines represent simulations of uniform random alignments spanning origins, with length distributions of alignments from each set of data curves. Long dashed lines represent the same type of simulation with no requirement for alignments to span origins. Both the green and purple data curves reside close to the ‘strong origin selection’ models or the small, dotted lines. The blue parameter regime, which we would expect to cluster more noise because we are being more lenient with filtering thresholds, differs at least to a larger degree than green/purple. Overall, however, all three parameter regimes perform similarly, suggesting that the shape of these distributions and the claims we are making here are robust at least to changes in parameter values in our structure detection pipeline. In another sense, this suggests that minimap2 is already neglecting most base-level changes very well and only considering severe deviations in expected collinearity to be the end of alignments that form breakpoints.

