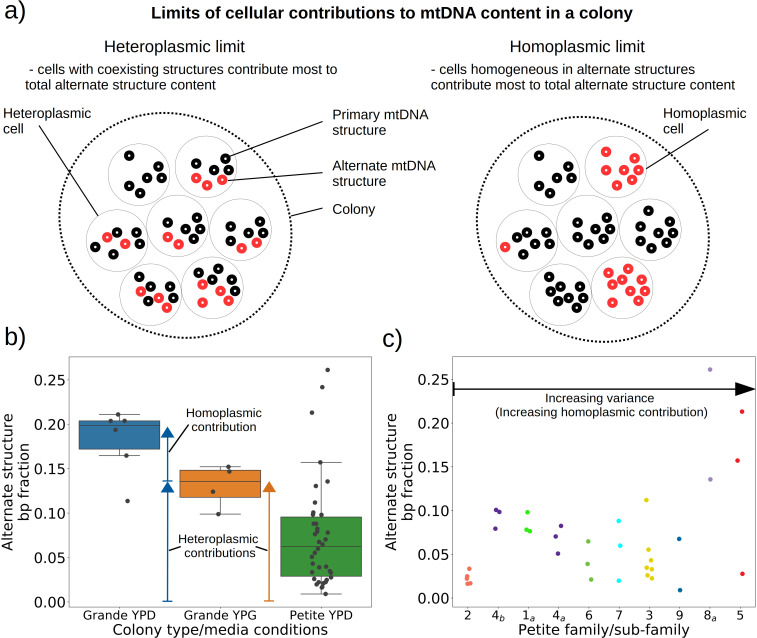
Figure 6. Evidence of heteroplasmy and homoplasmy in Grande and Petite colonies.
(a) A schematic of the two limits of cellular contributions to mtDNA content in a colony. Left: In the heteroplasmic limit, most of the contribution to total alternate structure content comes from cells containing coexisting alternate and primary structures. Right: In the homoplasmic limit, most alternate structure content comes from cells homogeneous in alternate structure content. (b) The total fraction in bp of reads that include any breakpoint not expected from the primary structure in Grande samples in YPD (fermentable carbon source), YPG (non-fermentable), and Petite samples in YPD. Each dot represents the alternate structure content fraction for a single colony, which is the fractional contribution to total mitochondrial content of reads that contain breakpoints that differ from breakpoints in the primary structure. The box plot displays the median value, and the minimum, maximum, first quartile, and third quartile. Blue vectors indicate heteroplasmic/homoplasmic contributions in Grande colonies in YPD. The orange vector indicates heteroplasmic contributions in Grande colonies in YPG. (c) Contributions of petite families/subfamilies to the Petite YPD alternate structure bp fractions in (b) sorted by variance in alternate structure basepair fractions in each subfamily. The arrow indicates that increasing variance is expected to be accompanied by increasing homoplasmic contributions.

