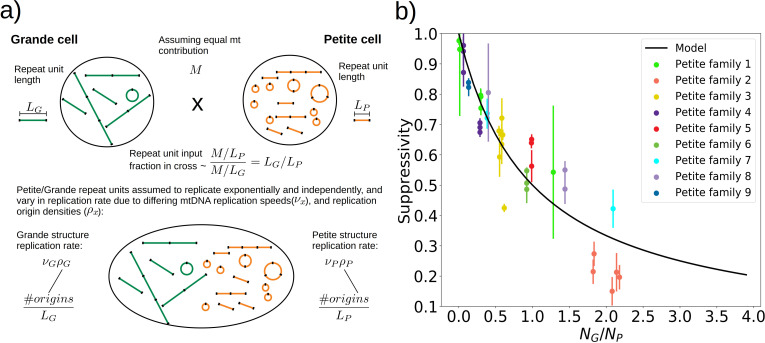
Figure 8. A phenomenological model of suppressivity.
(a) A visual depiction of a phenomenological model of suppressivity. Grande and Petite cells are assumed to contribute equal quantities of mtDNA. It is also assumed that each repeat unit replicates independently and exponentially and that during mating the repeat unit input fractions of Grandes and Petites are inversely proportional to repeat unit length. Exponential growth rates are the product of mtDNA replication speeds and origin densities. (b) Suppressivity of all samples compared to a fit of equation (1), which is the black line. The fit parameters are bp, bp, and the coefficient of determination is . Dots are the average suppressivity across three second passage Petite colonies that share the same first passage progenitor and belong to the families indicated in the legend (same colored dots share a spontaneous Petite colony progenitor). Y-axis error bars are ± the standard deviation in suppressivities across these three second passage Petites colonies. Samples containing inverted breakpoints in their primary structure are those derived from families 2 and 3, the orange and yellow dots, respectively. Family 3 is the mixed structures described in the text.

