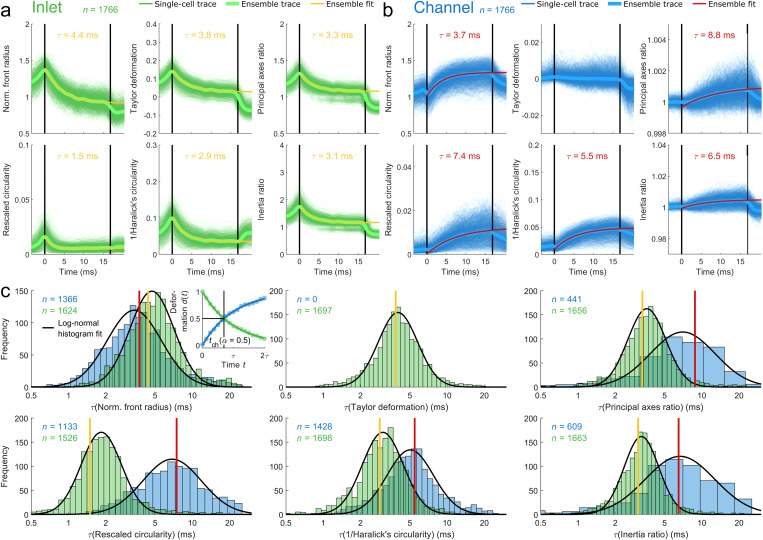
FIG. 3.
Dynamics of shape descriptors for reconstructed Fourier traces. (a) and (b) Cell shapes are decomposed by Fourier transformation and reconstructed from two subsets of first ten Fourier coefficients (FCs): even FC representing inlet effects [(a), green traces] and odd FC including coefficient zero representing channel effects [(b), blue traces]. Deformation dynamics are shown for 1766 HL60 cells passing a 30 × 30 μm2 channel of 300 μm length at a flow rate of 8 nl s−1. Ensemble response (median) of all cells was calculated (bold green and bold blue lines) while yellow (a) and red lines (b) represent an exponential fit to median traces. Vertical black lines indicate channel inlet and outlet. (c) Single cell analysis is performed by fitting an exponential function to the data, calculation of characteristic times , and filtering the resulting traces for a minimal amplitude fraction of as well as plotting histograms on logarithmic scale. Distributions are filtered for validity of the fit ( ). Solid black lines indicate a lognormal fit to the histograms filtering data for ±1.96 σ (95%) with respect to median to reject outliers. Vertical red and yellow lines show a comparison to relaxation times from ensemble fit in (a) and (b). Inset in the top left panel shows an exemplary sketch of deformation representing an inlet (green dots) and channel (blue dots) trace and corresponding exponential fits (solid lines). Translocation time is indicated for an amplitude fraction of (vertical black line).

