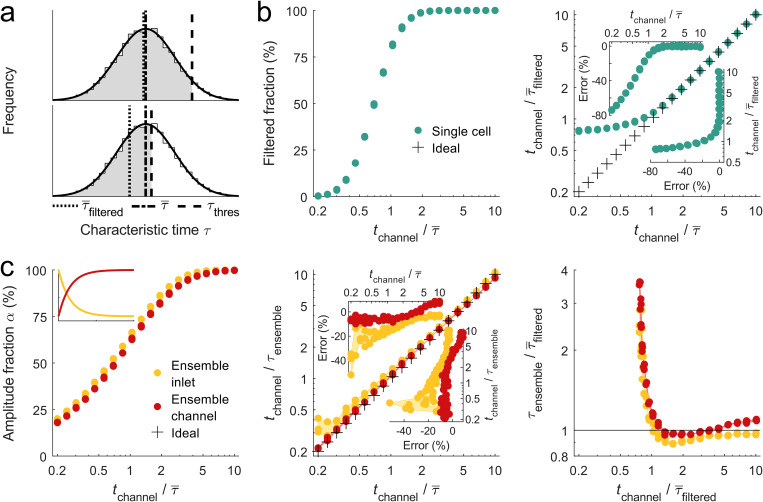
FIG. 4.
Characteristic time simulation for cell shape dynamics. (a) Lognormal distribution of 104 characteristic times with and ( and have been estimated from experimental data, is set to 1 ms). In experiments, is usually not accessible due to finite channel length and is replaced by , which depends on the upper limit of accessible characteristic times . (b) Filtered fraction of single cell characteristic time distribution as a function of channel translocation time normalized to (left panel) and comparison between normalized to and (right panel), respectively. Insets show error for projections of x and y axis, respectively. (c) Amplitude fraction as a function of normalized channel translocation time for ensemble analysis of inlet (yellow) and channel data (red). The inset shows exemplary deformation traces for inlet (yellow) and channel (red) shape dynamics. Center panel describes normalized to ensemble characteristic time as a function normalized to the median characteristic time from single cell analysis. The right panel compares to since experimental data do not allow accessing the full characteristic time distribution. Crosses indicate the ideal case without any bias. For every set of parameters, three simulation runs are shown.

