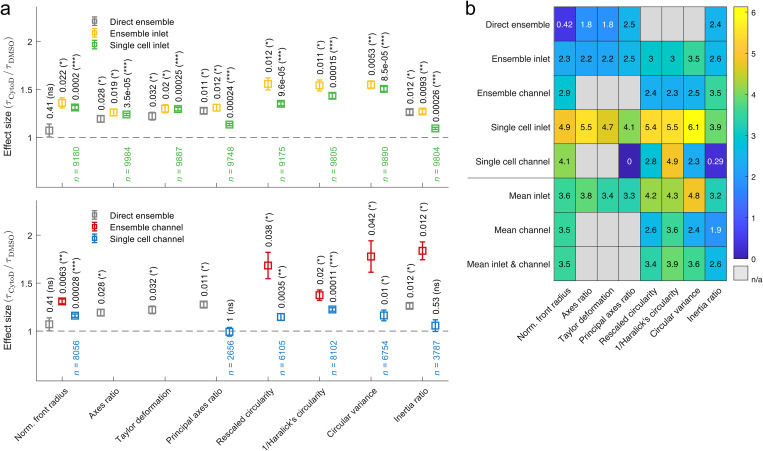
FIG. 5.
Effect size and score for shape descriptors after cell exposure to CytoD. (a) Effect size for characteristic times of inlet traces (top) and channel traces (bottom) calculated from the ratio of characteristic times of cells treated with 1 μM CytoD and the respective 0.25% (v/v) DMSO vehicle control. Analysis has been performed by fitting an exponential function to the median trace reconstructed from even (yellow) and odd (red) Fourier coefficients (ensemble analysis) as well as by fitting an exponential function to each individual cell trace reconstructed from even (green) and odd (blue) Fourier coefficients (single cell analysis). Since channel relaxation time of principal axes ratio for CytoD treatment exceeds , it is excluded (Fig. S8 in the supplementary material). The gray data points represent a direct ensemble cell analysis without Fourier decomposition. For ensemble analysis, statistical significance has been obtained from a one-parametric t-test, while for single cell analysis, statistical significance has been obtained by linear mixed-effect models. The resulting p-values are reported on top of data points. Error bars represent standard error of the mean. (b) Heat map: to combine effect size and significance level into a scalar. Increasing numbers in color scale represent increasing scores (ns, not significant ). Measurements have been carried out in 1% (v/v) MC-PBS corresponding to a viscosity of 27.8 mPa s at an experimental shear rate of 5105 s−1.

