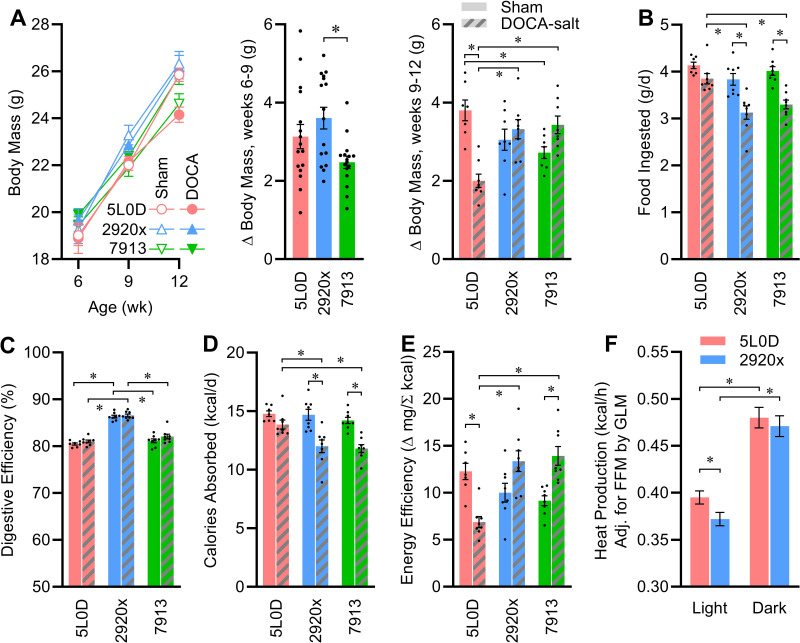
Figure 2.
Interactive effects of diet and DOCA-salt treatment on energy balance. A: body masses vs. time, change in body mass between weeks 6 and 9: one-way ANOVA P = 0.01; and change in body mass between weeks 9 and 12: two-way ANOVA diet P = 0.45, DOCA P = 0.14, diet × DOCA P < 0.01. B: food intake: two-way ANOVA diet P < 0.01, DOCA P < 0.01, diet × DOCA P = 0.09. C: digestive efficiency: two-way ANOVA diet P < 0.01, DOCA P = 0.06, diet × DOCA P = 0.66. D: calories absorbed per day: two-way ANOVA diet P < 0.01, DOCA P < 0.01, diet × DOCA P = 0.07. E: energy efficiency: two-way ANOVA diet P = 0.04, DOCA P = 0.21, diet × DOCA P < 0.01. F: aerobic heat production determined by O2/CO2 respirometry and averaged across the entire light phase or dark phase, and estimated marginal means are presented at covariate values of FFM = 19.31 g, fat mass = 5.93 g; light phase: FFM P < 0.01, fat P = 1.00, diet P = 0.04/dark phase: FFM P = 0.01, fat P = 0.85, diet P = 0.53. For A–F, n = 8 for all groups except n = 7 for week 12 5L0D + sham, and data are presented as means ± SE, and *P < 0.05 by Tukey’s multiple comparisons procedure. DOCA, deoxycorticosterone acetate; FFM, Fat-free mass.

