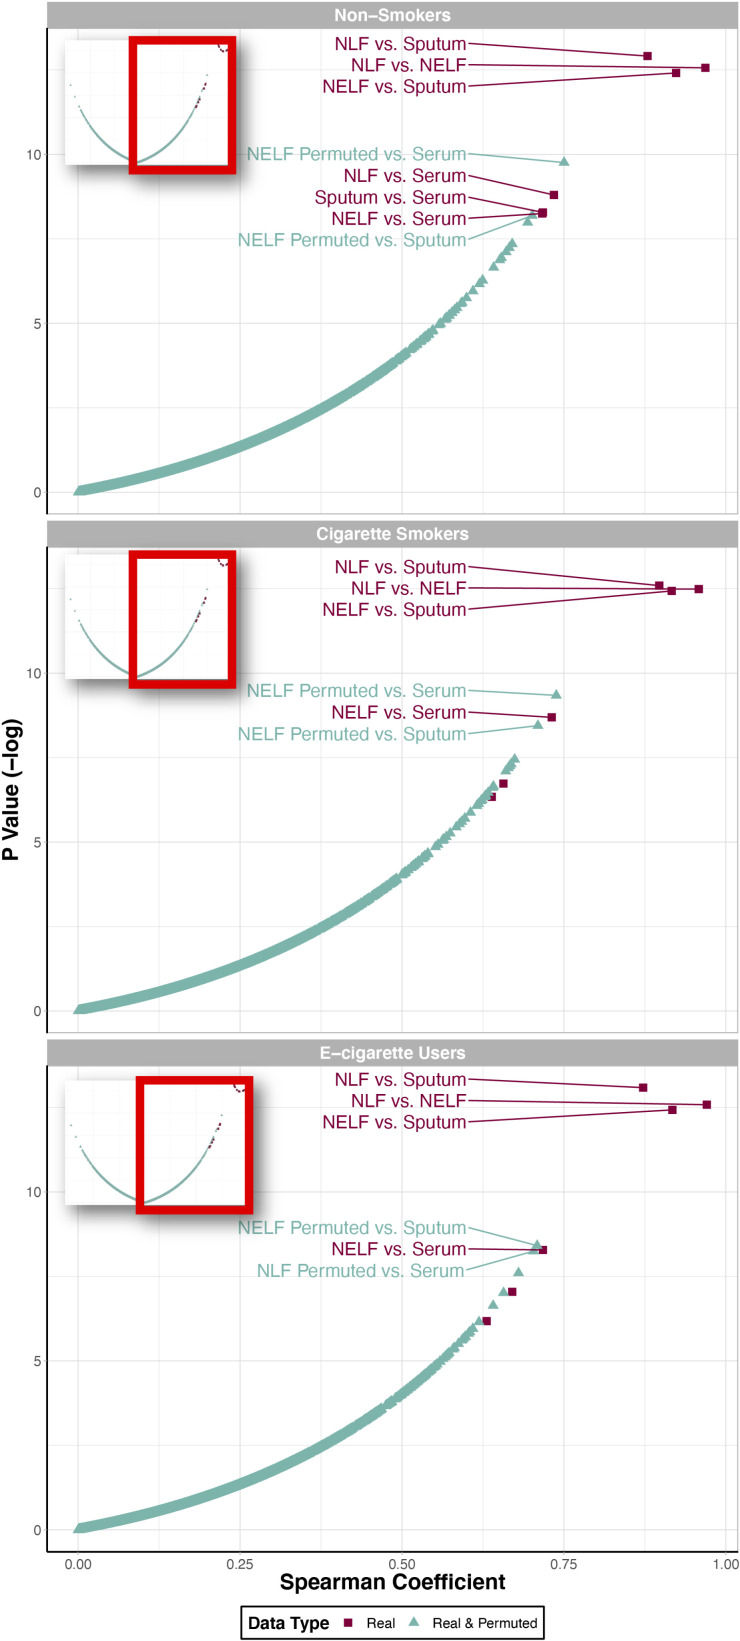
Figure 2.
Comparison of cytokine distribution similarity across compartments stratified by smoking status, identified through correlation and random permutation analyses. Two “data types” are included here: 1) “Real” data (in red boxes), which refer to the correlation results between two experimentally observed cytokine concentration datasets and 2) “real and simulated” data (in turquoise triangles), which refer to the correlation results between one experimentally observed cytokine concentration data set (i.e., the “real” data set) and one simulated dataset that was randomly generated based on the original data set. Points were labeled with the compartment comparison text identifiers if they were highly correlated and statistically significant (R > 0.7 and P < 0.05).

