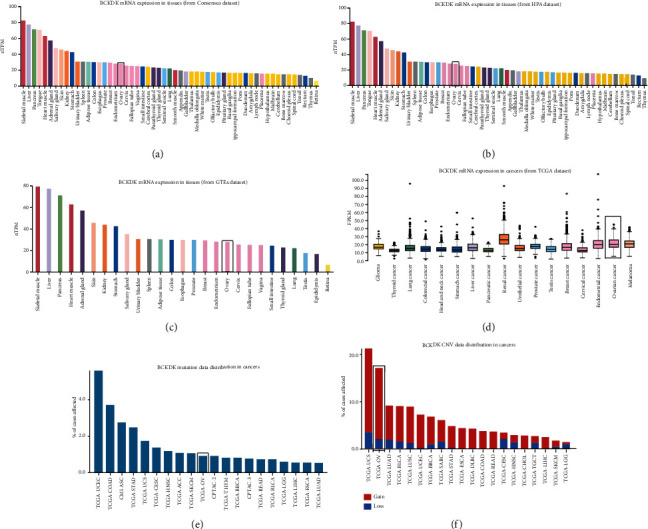
Figure 1.

Distribution of BCKDK mRNA in normal tissues and cancers. (a–c) BCKDK mRNA expression levels in normal tissues indexed from Consensus dataset, HPA dataset, and GTEx database, respectively. (d) BCKDK mRNA expression levels in cancers indexed from TCGA dataset. (e–f) GDC online database was used to detect the DNA alterations of BCKDK in different human tumors, and data were indexed from TCGA database. Ovarian cancer had the second highest DNA amplification of BCKDK among these cancers tested. Red bar represents CNV gain, and blue bar represents CNV loss. Rectangle marks normal ovarian tissue data or ovarian cancer.
